Immigrants from Lebanon vs Bangladeshi Hearing Disability
COMPARE
Immigrants from Lebanon
Bangladeshi
Hearing Disability
Hearing Disability Comparison
Immigrants from Lebanon
Bangladeshis
2.9%
HEARING DISABILITY
71.5/ 100
METRIC RATING
154th/ 347
METRIC RANK
3.2%
HEARING DISABILITY
8.1/ 100
METRIC RATING
215th/ 347
METRIC RANK
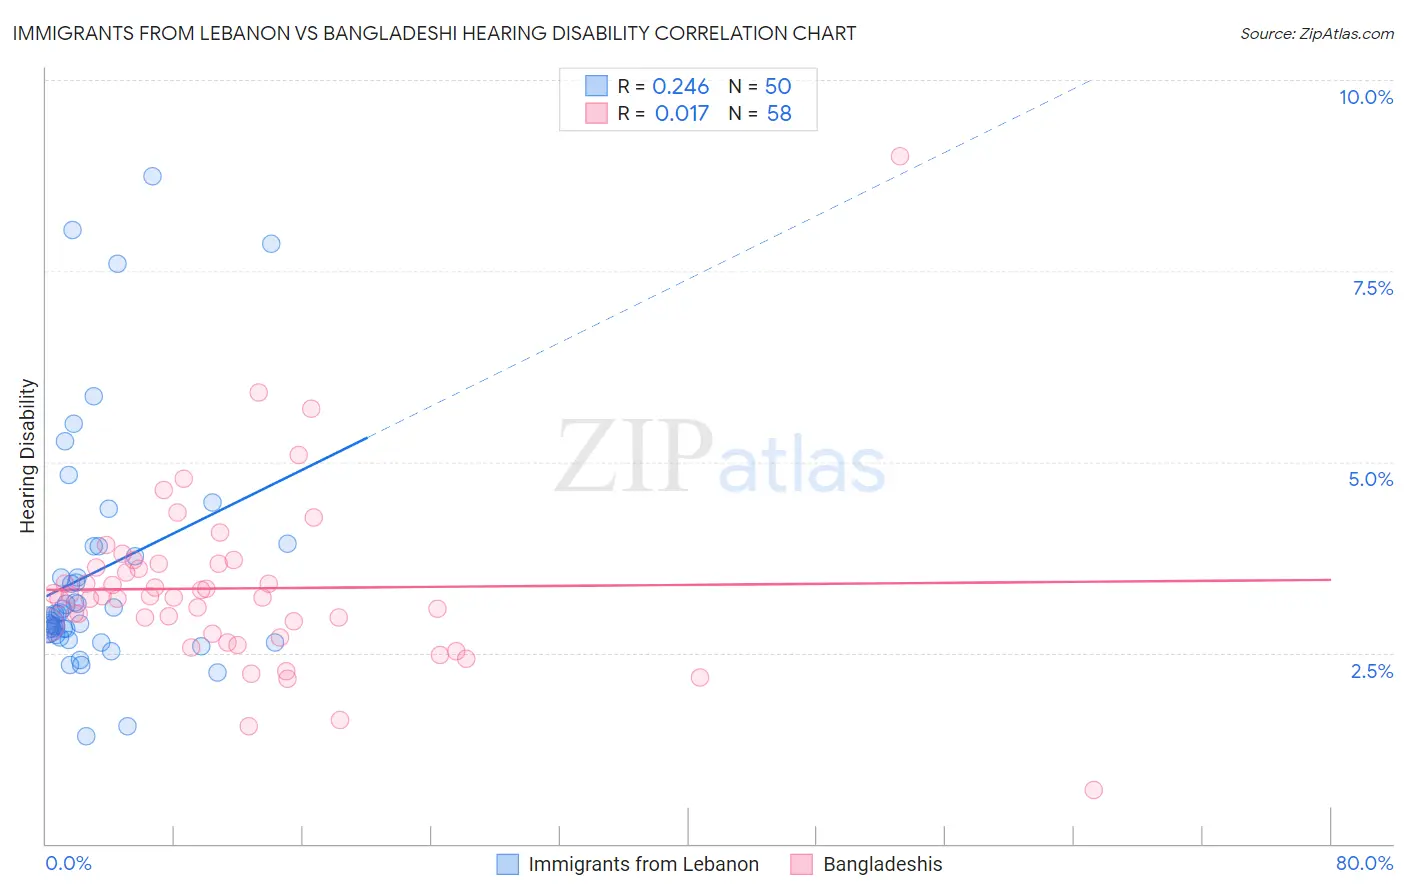
Immigrants from Lebanon vs Bangladeshi Hearing Disability Correlation Chart
The statistical analysis conducted on geographies consisting of 217,145,766 people shows a weak positive correlation between the proportion of Immigrants from Lebanon and percentage of population with hearing disability in the United States with a correlation coefficient (R) of 0.246 and weighted average of 2.9%. Similarly, the statistical analysis conducted on geographies consisting of 141,366,446 people shows no correlation between the proportion of Bangladeshis and percentage of population with hearing disability in the United States with a correlation coefficient (R) of 0.017 and weighted average of 3.2%, a difference of 8.0%.
Hearing Disability Correlation Summary
| Measurement | Immigrants from Lebanon | Bangladeshi |
| Minimum | 1.4% | 0.71% |
| Maximum | 8.7% | 9.0% |
| Range | 7.3% | 8.3% |
| Mean | 3.6% | 3.3% |
| Median | 3.0% | 3.2% |
| Interquartile 25% (IQ1) | 2.7% | 2.8% |
| Interquartile 75% (IQ3) | 3.9% | 3.7% |
| Interquartile Range (IQR) | 1.2% | 0.90% |
| Standard Deviation (Sample) | 1.6% | 1.2% |
| Standard Deviation (Population) | 1.6% | 1.2% |
Similar Demographics by Hearing Disability
Demographics Similar to Immigrants from Lebanon by Hearing Disability
In terms of hearing disability, the demographic groups most similar to Immigrants from Lebanon are Costa Rican (2.9%, a difference of 0.010%), Sudanese (2.9%, a difference of 0.070%), Immigrants from Poland (2.9%, a difference of 0.15%), Immigrants from Lithuania (2.9%, a difference of 0.18%), and Immigrants from France (2.9%, a difference of 0.19%).
| Demographics | Rating | Rank | Hearing Disability |
| Tongans | 78.6 /100 | #147 | Good 2.9% |
| Immigrants | Russia | 77.7 /100 | #148 | Good 2.9% |
| Immigrants | Panama | 76.9 /100 | #149 | Good 2.9% |
| Palestinians | 73.6 /100 | #150 | Good 2.9% |
| Immigrants | France | 73.1 /100 | #151 | Good 2.9% |
| Immigrants | Lithuania | 73.0 /100 | #152 | Good 2.9% |
| Sudanese | 72.1 /100 | #153 | Good 2.9% |
| Immigrants | Lebanon | 71.5 /100 | #154 | Good 2.9% |
| Costa Ricans | 71.4 /100 | #155 | Good 2.9% |
| Immigrants | Poland | 70.2 /100 | #156 | Good 2.9% |
| Immigrants | Kazakhstan | 69.6 /100 | #157 | Good 2.9% |
| Immigrants | Burma/Myanmar | 69.5 /100 | #158 | Good 2.9% |
| Immigrants | Australia | 67.4 /100 | #159 | Good 2.9% |
| Immigrants | Fiji | 67.1 /100 | #160 | Good 2.9% |
| Albanians | 66.6 /100 | #161 | Good 2.9% |
Demographics Similar to Bangladeshis by Hearing Disability
In terms of hearing disability, the demographic groups most similar to Bangladeshis are Australian (3.2%, a difference of 0.010%), Immigrants from Norway (3.2%, a difference of 0.24%), Russian (3.2%, a difference of 0.32%), Immigrants from Northern Europe (3.2%, a difference of 0.35%), and New Zealander (3.2%, a difference of 0.41%).
| Demographics | Rating | Rank | Hearing Disability |
| Immigrants | Latvia | 12.7 /100 | #208 | Poor 3.1% |
| Immigrants | Hungary | 12.5 /100 | #209 | Poor 3.1% |
| Cape Verdeans | 12.2 /100 | #210 | Poor 3.1% |
| Romanians | 12.1 /100 | #211 | Poor 3.1% |
| Pakistanis | 11.1 /100 | #212 | Poor 3.1% |
| Immigrants | Iraq | 10.5 /100 | #213 | Poor 3.1% |
| Australians | 8.1 /100 | #214 | Tragic 3.2% |
| Bangladeshis | 8.1 /100 | #215 | Tragic 3.2% |
| Immigrants | Norway | 7.3 /100 | #216 | Tragic 3.2% |
| Russians | 7.1 /100 | #217 | Tragic 3.2% |
| Immigrants | Northern Europe | 7.0 /100 | #218 | Tragic 3.2% |
| New Zealanders | 6.8 /100 | #219 | Tragic 3.2% |
| Malaysians | 6.6 /100 | #220 | Tragic 3.2% |
| Immigrants | Laos | 6.6 /100 | #221 | Tragic 3.2% |
| Immigrants | Oceania | 6.5 /100 | #222 | Tragic 3.2% |