Immigrants from Latin America vs Immigrants from Yemen Disability Age 18 to 34
COMPARE
Immigrants from Latin America
Immigrants from Yemen
Disability Age 18 to 34
Disability Age 18 to 34 Comparison
Immigrants from Latin America
Immigrants from Yemen
6.3%
DISABILITY AGE 18 TO 34
94.9/ 100
METRIC RATING
113th/ 347
METRIC RANK
7.0%
DISABILITY AGE 18 TO 34
4.2/ 100
METRIC RATING
228th/ 347
METRIC RANK
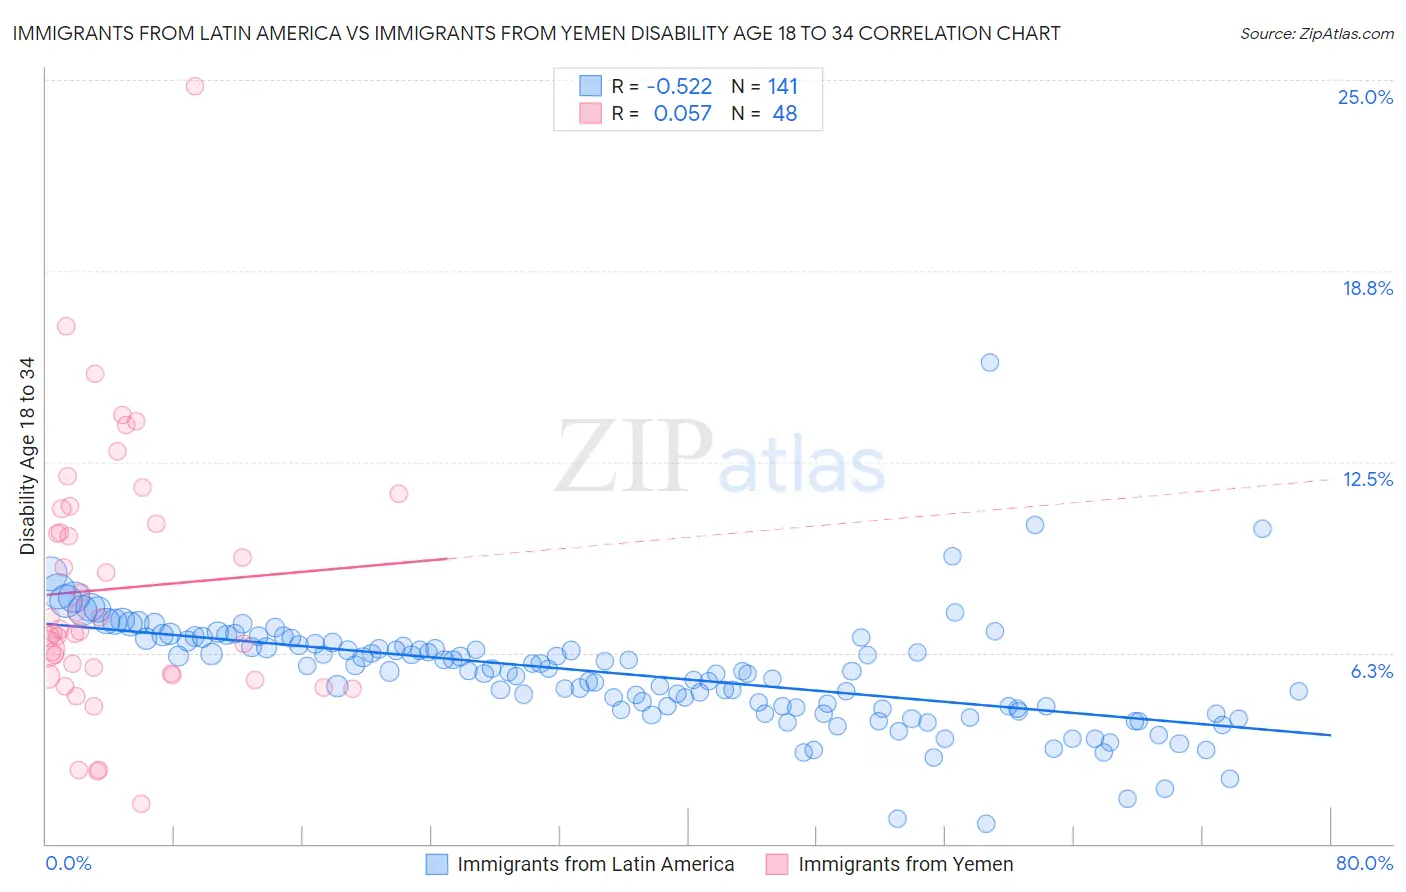
Immigrants from Latin America vs Immigrants from Yemen Disability Age 18 to 34 Correlation Chart
The statistical analysis conducted on geographies consisting of 554,113,757 people shows a substantial negative correlation between the proportion of Immigrants from Latin America and percentage of population with a disability between the ages 18 and 35 in the United States with a correlation coefficient (R) of -0.522 and weighted average of 6.3%. Similarly, the statistical analysis conducted on geographies consisting of 82,428,971 people shows a slight positive correlation between the proportion of Immigrants from Yemen and percentage of population with a disability between the ages 18 and 35 in the United States with a correlation coefficient (R) of 0.057 and weighted average of 7.0%, a difference of 11.1%.
Disability Age 18 to 34 Correlation Summary
| Measurement | Immigrants from Latin America | Immigrants from Yemen |
| Minimum | 0.64% | 1.3% |
| Maximum | 15.8% | 24.8% |
| Range | 15.1% | 23.5% |
| Mean | 5.6% | 8.4% |
| Median | 5.6% | 7.0% |
| Interquartile 25% (IQ1) | 4.4% | 5.6% |
| Interquartile 75% (IQ3) | 6.6% | 10.7% |
| Interquartile Range (IQR) | 2.1% | 5.2% |
| Standard Deviation (Sample) | 1.9% | 4.3% |
| Standard Deviation (Population) | 1.8% | 4.2% |
Similar Demographics by Disability Age 18 to 34
Demographics Similar to Immigrants from Latin America by Disability Age 18 to 34
In terms of disability age 18 to 34, the demographic groups most similar to Immigrants from Latin America are Immigrants from Romania (6.3%, a difference of 0.0%), Immigrants from France (6.3%, a difference of 0.090%), Immigrants from Brazil (6.3%, a difference of 0.10%), Immigrants from South Eastern Asia (6.3%, a difference of 0.18%), and Sri Lankan (6.2%, a difference of 0.25%).
| Demographics | Rating | Rank | Disability Age 18 to 34 |
| Immigrants | Afghanistan | 95.9 /100 | #106 | Exceptional 6.2% |
| Ethiopians | 95.8 /100 | #107 | Exceptional 6.2% |
| Immigrants | Croatia | 95.7 /100 | #108 | Exceptional 6.2% |
| Sri Lankans | 95.5 /100 | #109 | Exceptional 6.2% |
| Immigrants | Brazil | 95.2 /100 | #110 | Exceptional 6.3% |
| Immigrants | France | 95.1 /100 | #111 | Exceptional 6.3% |
| Immigrants | Romania | 94.9 /100 | #112 | Exceptional 6.3% |
| Immigrants | Latin America | 94.9 /100 | #113 | Exceptional 6.3% |
| Immigrants | South Eastern Asia | 94.4 /100 | #114 | Exceptional 6.3% |
| Koreans | 94.1 /100 | #115 | Exceptional 6.3% |
| Immigrants | Costa Rica | 94.0 /100 | #116 | Exceptional 6.3% |
| Immigrants | Jordan | 94.0 /100 | #117 | Exceptional 6.3% |
| Immigrants | Nepal | 93.7 /100 | #118 | Exceptional 6.3% |
| Chileans | 93.5 /100 | #119 | Exceptional 6.3% |
| Immigrants | Ukraine | 93.4 /100 | #120 | Exceptional 6.3% |
Demographics Similar to Immigrants from Yemen by Disability Age 18 to 34
In terms of disability age 18 to 34, the demographic groups most similar to Immigrants from Yemen are Lithuanian (7.0%, a difference of 0.030%), Immigrants from Canada (7.0%, a difference of 0.050%), Ugandan (6.9%, a difference of 0.10%), Immigrants from North America (7.0%, a difference of 0.12%), and Ute (7.0%, a difference of 0.14%).
| Demographics | Rating | Rank | Disability Age 18 to 34 |
| Immigrants | Middle Africa | 5.5 /100 | #221 | Tragic 6.9% |
| Immigrants | England | 5.3 /100 | #222 | Tragic 6.9% |
| Carpatho Rusyns | 5.2 /100 | #223 | Tragic 6.9% |
| Senegalese | 4.9 /100 | #224 | Tragic 6.9% |
| Central American Indians | 4.7 /100 | #225 | Tragic 6.9% |
| Ugandans | 4.4 /100 | #226 | Tragic 6.9% |
| Immigrants | Canada | 4.3 /100 | #227 | Tragic 7.0% |
| Immigrants | Yemen | 4.2 /100 | #228 | Tragic 7.0% |
| Lithuanians | 4.1 /100 | #229 | Tragic 7.0% |
| Immigrants | North America | 3.9 /100 | #230 | Tragic 7.0% |
| Ute | 3.8 /100 | #231 | Tragic 7.0% |
| Samoans | 3.2 /100 | #232 | Tragic 7.0% |
| New Zealanders | 2.7 /100 | #233 | Tragic 7.0% |
| Alsatians | 2.1 /100 | #234 | Tragic 7.0% |
| Sub-Saharan Africans | 1.7 /100 | #235 | Tragic 7.1% |