Immigrants from Laos vs South African Disability Age 35 to 64
COMPARE
Immigrants from Laos
South African
Disability Age 35 to 64
Disability Age 35 to 64 Comparison
Immigrants from Laos
South Africans
13.0%
DISABILITY AGE 35 TO 64
0.1/ 100
METRIC RATING
282nd/ 347
METRIC RANK
10.7%
DISABILITY AGE 35 TO 64
93.3/ 100
METRIC RATING
128th/ 347
METRIC RANK
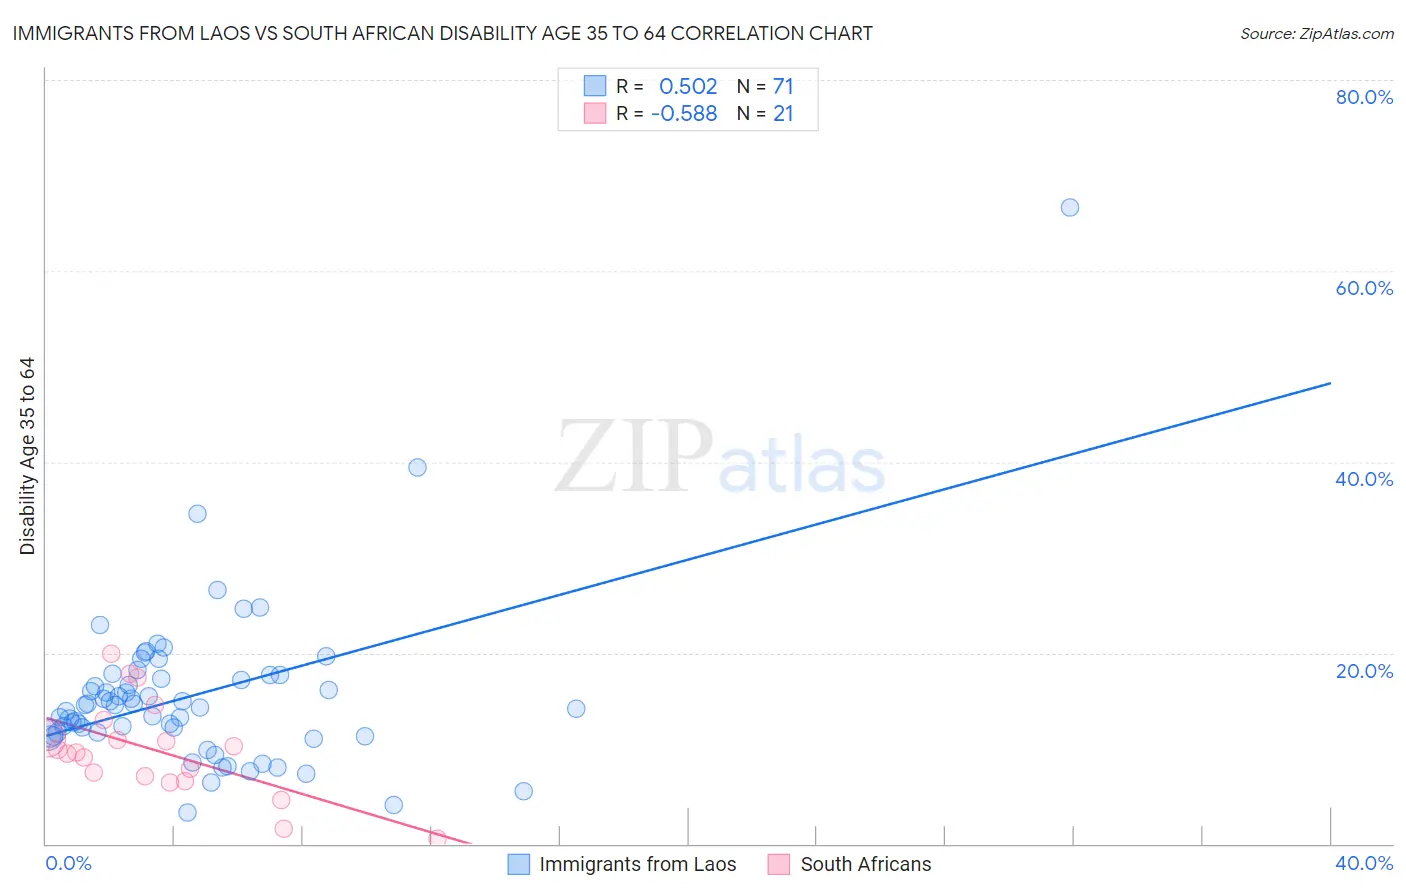
Immigrants from Laos vs South African Disability Age 35 to 64 Correlation Chart
The statistical analysis conducted on geographies consisting of 201,466,921 people shows a substantial positive correlation between the proportion of Immigrants from Laos and percentage of population with a disability between the ages 34 and 64 in the United States with a correlation coefficient (R) of 0.502 and weighted average of 13.0%. Similarly, the statistical analysis conducted on geographies consisting of 182,548,455 people shows a substantial negative correlation between the proportion of South Africans and percentage of population with a disability between the ages 34 and 64 in the United States with a correlation coefficient (R) of -0.588 and weighted average of 10.7%, a difference of 21.6%.
Disability Age 35 to 64 Correlation Summary
| Measurement | Immigrants from Laos | South African |
| Minimum | 3.3% | 0.50% |
| Maximum | 66.7% | 19.9% |
| Range | 63.4% | 19.4% |
| Mean | 15.5% | 9.8% |
| Median | 14.5% | 9.5% |
| Interquartile 25% (IQ1) | 11.5% | 6.8% |
| Interquartile 75% (IQ3) | 17.6% | 12.0% |
| Interquartile Range (IQR) | 6.2% | 5.2% |
| Standard Deviation (Sample) | 8.6% | 4.9% |
| Standard Deviation (Population) | 8.6% | 4.8% |
Similar Demographics by Disability Age 35 to 64
Demographics Similar to Immigrants from Laos by Disability Age 35 to 64
In terms of disability age 35 to 64, the demographic groups most similar to Immigrants from Laos are Scotch-Irish (13.0%, a difference of 0.090%), Liberian (12.9%, a difference of 0.29%), Central American Indian (13.0%, a difference of 0.39%), Immigrants from Micronesia (12.9%, a difference of 0.46%), and French Canadian (12.9%, a difference of 0.48%).
| Demographics | Rating | Rank | Disability Age 35 to 64 |
| Dominicans | 0.1 /100 | #275 | Tragic 12.9% |
| Somalis | 0.1 /100 | #276 | Tragic 12.9% |
| Immigrants | Dominican Republic | 0.1 /100 | #277 | Tragic 12.9% |
| French Canadians | 0.1 /100 | #278 | Tragic 12.9% |
| Immigrants | Micronesia | 0.1 /100 | #279 | Tragic 12.9% |
| Liberians | 0.1 /100 | #280 | Tragic 12.9% |
| Scotch-Irish | 0.1 /100 | #281 | Tragic 13.0% |
| Immigrants | Laos | 0.1 /100 | #282 | Tragic 13.0% |
| Central American Indians | 0.0 /100 | #283 | Tragic 13.0% |
| Immigrants | Nonimmigrants | 0.0 /100 | #284 | Tragic 13.0% |
| Immigrants | Somalia | 0.0 /100 | #285 | Tragic 13.1% |
| Hmong | 0.0 /100 | #286 | Tragic 13.1% |
| Tlingit-Haida | 0.0 /100 | #287 | Tragic 13.2% |
| Fijians | 0.0 /100 | #288 | Tragic 13.2% |
| Indonesians | 0.0 /100 | #289 | Tragic 13.2% |
Demographics Similar to South Africans by Disability Age 35 to 64
In terms of disability age 35 to 64, the demographic groups most similar to South Africans are Ecuadorian (10.7%, a difference of 0.080%), Immigrants from Syria (10.7%, a difference of 0.11%), Immigrants from El Salvador (10.7%, a difference of 0.16%), Immigrants from Zimbabwe (10.6%, a difference of 0.23%), and Immigrants from Albania (10.7%, a difference of 0.27%).
| Demographics | Rating | Rank | Disability Age 35 to 64 |
| Romanians | 95.0 /100 | #121 | Exceptional 10.6% |
| Immigrants | Norway | 95.0 /100 | #122 | Exceptional 10.6% |
| Maltese | 94.8 /100 | #123 | Exceptional 10.6% |
| Estonians | 94.5 /100 | #124 | Exceptional 10.6% |
| Albanians | 94.2 /100 | #125 | Exceptional 10.6% |
| Immigrants | Afghanistan | 94.1 /100 | #126 | Exceptional 10.6% |
| Immigrants | Zimbabwe | 94.0 /100 | #127 | Exceptional 10.6% |
| South Africans | 93.3 /100 | #128 | Exceptional 10.7% |
| Ecuadorians | 93.1 /100 | #129 | Exceptional 10.7% |
| Immigrants | Syria | 93.0 /100 | #130 | Exceptional 10.7% |
| Immigrants | El Salvador | 92.8 /100 | #131 | Exceptional 10.7% |
| Immigrants | Albania | 92.5 /100 | #132 | Exceptional 10.7% |
| Immigrants | Immigrants | 92.5 /100 | #133 | Exceptional 10.7% |
| Immigrants | Ecuador | 92.5 /100 | #134 | Exceptional 10.7% |
| Greeks | 92.3 /100 | #135 | Exceptional 10.7% |