Immigrants from Korea vs Immigrants from Costa Rica Male Disability
COMPARE
Immigrants from Korea
Immigrants from Costa Rica
Male Disability
Male Disability Comparison
Immigrants from Korea
Immigrants from Costa Rica
9.8%
MALE DISABILITY
100.0/ 100
METRIC RATING
17th/ 347
METRIC RANK
11.0%
MALE DISABILITY
82.8/ 100
METRIC RATING
136th/ 347
METRIC RANK
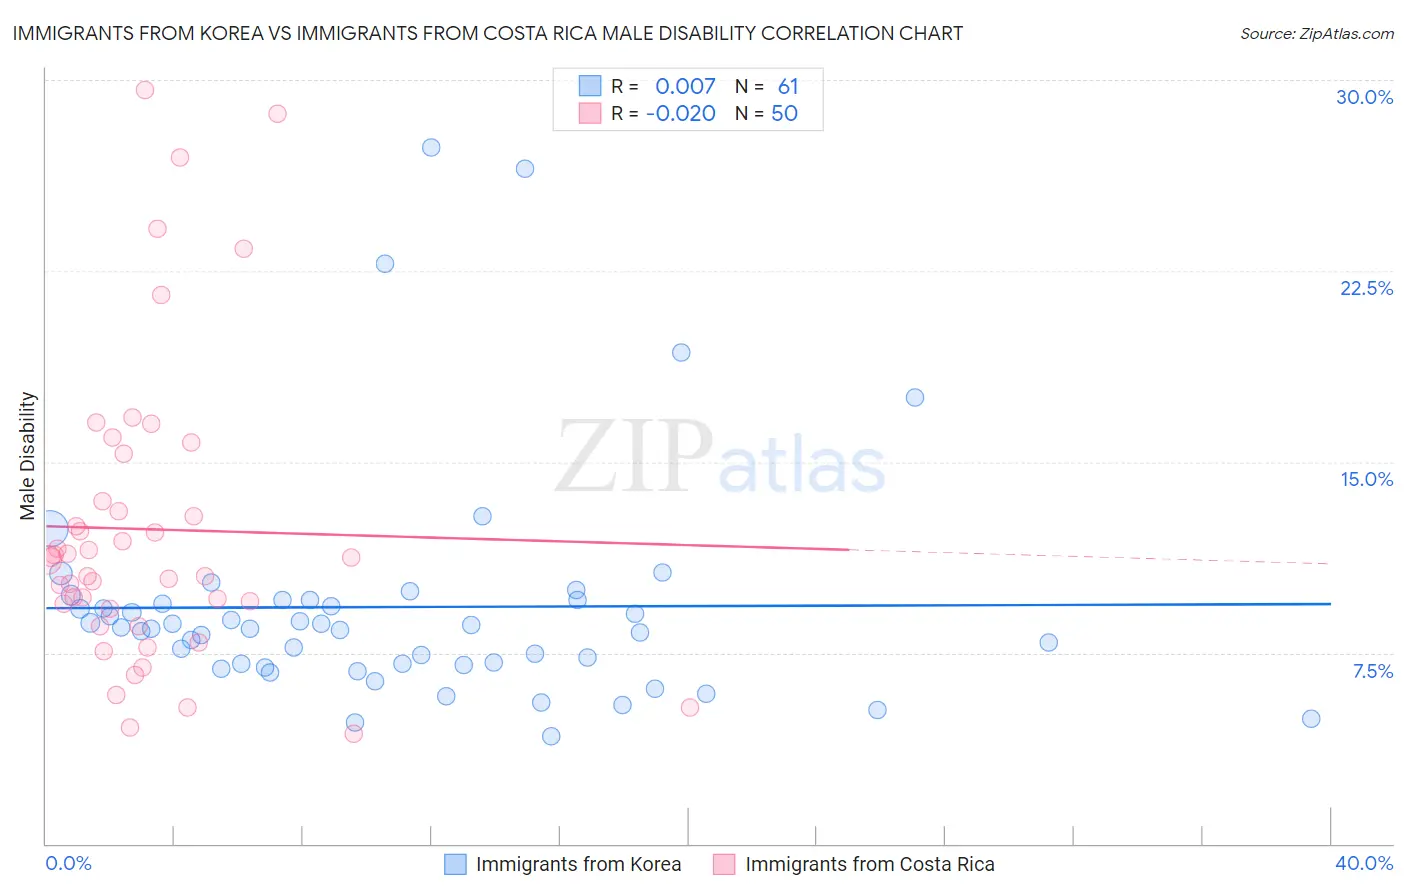
Immigrants from Korea vs Immigrants from Costa Rica Male Disability Correlation Chart
The statistical analysis conducted on geographies consisting of 416,248,293 people shows no correlation between the proportion of Immigrants from Korea and percentage of males with a disability in the United States with a correlation coefficient (R) of 0.007 and weighted average of 9.8%. Similarly, the statistical analysis conducted on geographies consisting of 204,275,290 people shows no correlation between the proportion of Immigrants from Costa Rica and percentage of males with a disability in the United States with a correlation coefficient (R) of -0.020 and weighted average of 11.0%, a difference of 12.1%.
Male Disability Correlation Summary
| Measurement | Immigrants from Korea | Immigrants from Costa Rica |
| Minimum | 4.2% | 4.3% |
| Maximum | 27.3% | 29.6% |
| Range | 23.1% | 25.3% |
| Mean | 9.3% | 12.4% |
| Median | 8.5% | 11.2% |
| Interquartile 25% (IQ1) | 7.0% | 9.2% |
| Interquartile 75% (IQ3) | 9.6% | 13.4% |
| Interquartile Range (IQR) | 2.5% | 4.2% |
| Standard Deviation (Sample) | 4.5% | 5.9% |
| Standard Deviation (Population) | 4.5% | 5.9% |
Similar Demographics by Male Disability
Demographics Similar to Immigrants from Korea by Male Disability
In terms of male disability, the demographic groups most similar to Immigrants from Korea are Okinawan (9.8%, a difference of 0.14%), Immigrants from Pakistan (9.8%, a difference of 0.56%), Indian (Asian) (9.7%, a difference of 0.75%), Immigrants from Iran (9.7%, a difference of 1.2%), and Iranian (9.7%, a difference of 1.3%).
| Demographics | Rating | Rank | Male Disability |
| Immigrants | Israel | 100.0 /100 | #10 | Exceptional 9.6% |
| Immigrants | Eastern Asia | 100.0 /100 | #11 | Exceptional 9.6% |
| Bolivians | 100.0 /100 | #12 | Exceptional 9.6% |
| Iranians | 100.0 /100 | #13 | Exceptional 9.7% |
| Immigrants | Iran | 100.0 /100 | #14 | Exceptional 9.7% |
| Indians (Asian) | 100.0 /100 | #15 | Exceptional 9.7% |
| Okinawans | 100.0 /100 | #16 | Exceptional 9.8% |
| Immigrants | Korea | 100.0 /100 | #17 | Exceptional 9.8% |
| Immigrants | Pakistan | 100.0 /100 | #18 | Exceptional 9.8% |
| Immigrants | Sri Lanka | 100.0 /100 | #19 | Exceptional 10.0% |
| Asians | 100.0 /100 | #20 | Exceptional 10.0% |
| Burmese | 100.0 /100 | #21 | Exceptional 10.0% |
| Immigrants | Venezuela | 100.0 /100 | #22 | Exceptional 10.0% |
| Cypriots | 100.0 /100 | #23 | Exceptional 10.0% |
| Immigrants | Asia | 100.0 /100 | #24 | Exceptional 10.0% |
Demographics Similar to Immigrants from Costa Rica by Male Disability
In terms of male disability, the demographic groups most similar to Immigrants from Costa Rica are Trinidadian and Tobagonian (11.0%, a difference of 0.040%), Bhutanese (11.0%, a difference of 0.060%), Immigrants from Europe (11.0%, a difference of 0.080%), Nigerian (11.0%, a difference of 0.090%), and Ugandan (11.0%, a difference of 0.11%).
| Demographics | Rating | Rank | Male Disability |
| Immigrants | Philippines | 85.4 /100 | #129 | Excellent 10.9% |
| Brazilians | 85.4 /100 | #130 | Excellent 10.9% |
| Macedonians | 84.2 /100 | #131 | Excellent 11.0% |
| Immigrants | Fiji | 84.0 /100 | #132 | Excellent 11.0% |
| Ugandans | 83.9 /100 | #133 | Excellent 11.0% |
| Bhutanese | 83.4 /100 | #134 | Excellent 11.0% |
| Trinidadians and Tobagonians | 83.3 /100 | #135 | Excellent 11.0% |
| Immigrants | Costa Rica | 82.8 /100 | #136 | Excellent 11.0% |
| Immigrants | Europe | 82.0 /100 | #137 | Excellent 11.0% |
| Nigerians | 81.9 /100 | #138 | Excellent 11.0% |
| South Africans | 81.7 /100 | #139 | Excellent 11.0% |
| Immigrants | Italy | 81.5 /100 | #140 | Excellent 11.0% |
| Arabs | 81.5 /100 | #141 | Excellent 11.0% |
| Immigrants | Sudan | 81.5 /100 | #142 | Excellent 11.0% |
| Moroccans | 80.7 /100 | #143 | Excellent 11.0% |