Immigrants from Kenya vs Sri Lankan Disability Age 35 to 64
COMPARE
Immigrants from Kenya
Sri Lankan
Disability Age 35 to 64
Disability Age 35 to 64 Comparison
Immigrants from Kenya
Sri Lankans
11.6%
DISABILITY AGE 35 TO 64
17.7/ 100
METRIC RATING
201st/ 347
METRIC RANK
10.2%
DISABILITY AGE 35 TO 64
99.2/ 100
METRIC RATING
84th/ 347
METRIC RANK
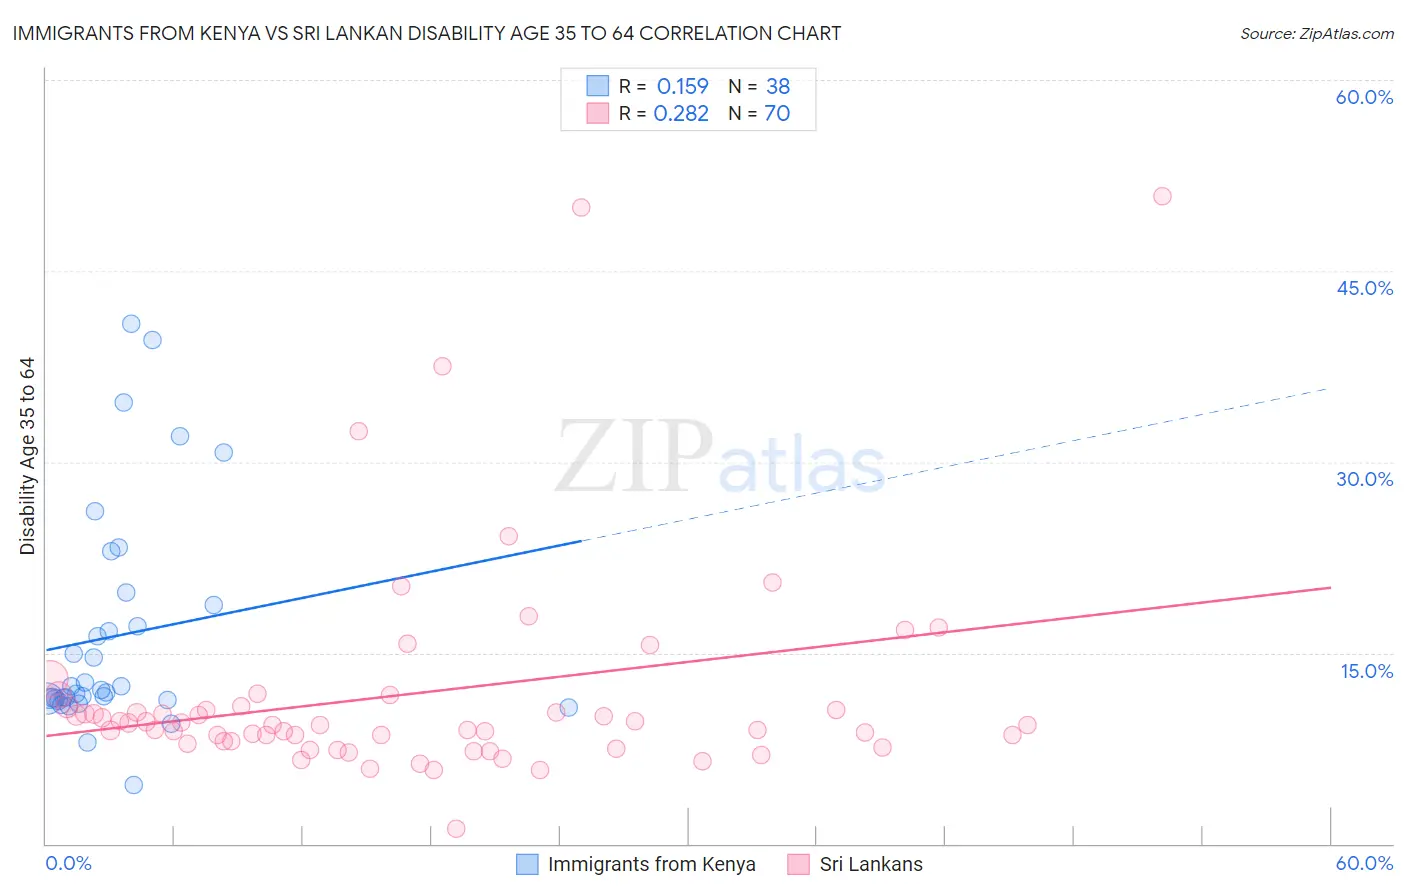
Immigrants from Kenya vs Sri Lankan Disability Age 35 to 64 Correlation Chart
The statistical analysis conducted on geographies consisting of 217,981,041 people shows a poor positive correlation between the proportion of Immigrants from Kenya and percentage of population with a disability between the ages 34 and 64 in the United States with a correlation coefficient (R) of 0.159 and weighted average of 11.6%. Similarly, the statistical analysis conducted on geographies consisting of 440,040,634 people shows a weak positive correlation between the proportion of Sri Lankans and percentage of population with a disability between the ages 34 and 64 in the United States with a correlation coefficient (R) of 0.282 and weighted average of 10.2%, a difference of 14.1%.
Disability Age 35 to 64 Correlation Summary
| Measurement | Immigrants from Kenya | Sri Lankan |
| Minimum | 4.6% | 1.2% |
| Maximum | 40.9% | 50.9% |
| Range | 36.2% | 49.7% |
| Mean | 16.3% | 11.8% |
| Median | 12.0% | 9.3% |
| Interquartile 25% (IQ1) | 11.4% | 8.0% |
| Interquartile 75% (IQ3) | 18.8% | 10.8% |
| Interquartile Range (IQR) | 7.4% | 2.7% |
| Standard Deviation (Sample) | 8.8% | 8.7% |
| Standard Deviation (Population) | 8.7% | 8.7% |
Similar Demographics by Disability Age 35 to 64
Demographics Similar to Immigrants from Kenya by Disability Age 35 to 64
In terms of disability age 35 to 64, the demographic groups most similar to Immigrants from Kenya are Immigrants from Guatemala (11.6%, a difference of 0.020%), British (11.6%, a difference of 0.090%), Swiss (11.6%, a difference of 0.13%), Nigerian (11.6%, a difference of 0.20%), and Basque (11.6%, a difference of 0.23%).
| Demographics | Rating | Rank | Disability Age 35 to 64 |
| Immigrants | Latin America | 27.5 /100 | #194 | Fair 11.5% |
| Carpatho Rusyns | 25.3 /100 | #195 | Fair 11.5% |
| Iraqis | 24.2 /100 | #196 | Fair 11.5% |
| Immigrants | Iraq | 21.0 /100 | #197 | Fair 11.6% |
| Immigrants | Panama | 20.4 /100 | #198 | Fair 11.6% |
| Basques | 19.5 /100 | #199 | Poor 11.6% |
| Swiss | 18.7 /100 | #200 | Poor 11.6% |
| Immigrants | Kenya | 17.7 /100 | #201 | Poor 11.6% |
| Immigrants | Guatemala | 17.5 /100 | #202 | Poor 11.6% |
| British | 17.0 /100 | #203 | Poor 11.6% |
| Nigerians | 16.3 /100 | #204 | Poor 11.6% |
| Slavs | 15.5 /100 | #205 | Poor 11.7% |
| Native Hawaiians | 14.8 /100 | #206 | Poor 11.7% |
| Ghanaians | 14.8 /100 | #207 | Poor 11.7% |
| Guatemalans | 14.6 /100 | #208 | Poor 11.7% |
Demographics Similar to Sri Lankans by Disability Age 35 to 64
In terms of disability age 35 to 64, the demographic groups most similar to Sri Lankans are Immigrants from Brazil (10.2%, a difference of 0.060%), Russian (10.2%, a difference of 0.080%), Latvian (10.2%, a difference of 0.13%), Immigrants from Kuwait (10.2%, a difference of 0.21%), and Immigrants from Croatia (10.2%, a difference of 0.23%).
| Demographics | Rating | Rank | Disability Age 35 to 64 |
| Mongolians | 99.4 /100 | #77 | Exceptional 10.1% |
| Jordanians | 99.3 /100 | #78 | Exceptional 10.1% |
| Immigrants | Vietnam | 99.3 /100 | #79 | Exceptional 10.1% |
| Immigrants | Croatia | 99.3 /100 | #80 | Exceptional 10.2% |
| Latvians | 99.2 /100 | #81 | Exceptional 10.2% |
| Russians | 99.2 /100 | #82 | Exceptional 10.2% |
| Immigrants | Brazil | 99.2 /100 | #83 | Exceptional 10.2% |
| Sri Lankans | 99.2 /100 | #84 | Exceptional 10.2% |
| Immigrants | Kuwait | 99.1 /100 | #85 | Exceptional 10.2% |
| Immigrants | Europe | 99.1 /100 | #86 | Exceptional 10.2% |
| Nicaraguans | 99.1 /100 | #87 | Exceptional 10.2% |
| Chileans | 99.0 /100 | #88 | Exceptional 10.2% |
| Uruguayans | 99.0 /100 | #89 | Exceptional 10.2% |
| Afghans | 98.9 /100 | #90 | Exceptional 10.3% |
| Immigrants | Lebanon | 98.9 /100 | #91 | Exceptional 10.3% |