Immigrants from Kazakhstan vs Immigrants from Afghanistan Disability Age 65 to 74

COMPARE

Immigrants from Kazakhstan
Race
Ancestry
AfghanAfricanAlaska NativeAlaskan AthabascanAlbanianAleutAlsatianAmericanApacheArabArapahoArgentineanArmenianAssyrian/Chaldean/SyriacAustralianAustrianBahamianBangladeshiBarbadianBasqueBelgianBelizeanBermudanBhutaneseBlackfeetBolivianBrazilianBritishBritish West IndianBulgarianBurmeseCajunCambodianCanadianCape VerdeanCarpatho RusynCelticCentral AmericanCentral American IndianCherokeeCheyenneChickasawChileanChineseChippewaChoctawColombianColvilleComancheCosta RicanCreeCreekCroatianCrowCubanCypriotCzechCzechoslovakianDanishDelawareDominicanDutchDutch West IndianEastern EuropeanEcuadorianEgyptianEnglishEstonianEthiopianEuropeanFijianFilipinoFinnishFrenchFrench American IndianFrench CanadianGermanGerman RussianGhanaianGreekGuamanian/ChamorroGuatemalanGuyaneseHaitianHmongHonduranHopiHoumaHungarianIcelanderIndian (Asian)IndonesianInupiatIranianIraqiIrishIroquoisIsraeliItalianJamaicanJapaneseJordanianKenyanKiowaKoreanLaotianLatvianLebaneseLiberianLithuanianLumbeeLuxembourgerMacedonianMalaysianMalteseMarshalleseMenomineeMexicanMexican American IndianMongolianMoroccanNative HawaiianNavajoNepaleseNew ZealanderNicaraguanNigerianNorthern EuropeanNorwegianOkinawanOsageOttawaPaiutePakistaniPalestinianPanamanianParaguayanPennsylvania GermanPeruvianPimaPolishPortuguesePotawatomiPuebloPuerto RicanPuget Sound SalishRomanianRussianSalvadoranSamoanScandinavianScotch-IrishScottishSeminoleSenegaleseSerbianShoshoneSierra LeoneanSiouxSlavicSlovakSloveneSomaliSouth AfricanSouth AmericanSouth American IndianSoviet UnionSpaniardSpanishSpanish AmericanSpanish American IndianSri LankanSubsaharan AfricanSudaneseSwedishSwissSyrianTaiwaneseThaiTlingit-HaidaTohono O'OdhamTonganTrinidadian and TobagonianTsimshianTurkishU.S. Virgin IslanderUgandanUkrainianUruguayanUteVenezuelanVietnameseWelshWest IndianYakamaYaquiYugoslavianYumanYup'ikZimbabwean
Immigration
NonimmigrantsImmigrantsAfricaAlbaniaArgentinaArmeniaAsiaAustraliaAustriaBahamasBangladeshBarbadosBelarusBelgiumBelizeBoliviaBosnia and HerzegovinaBrazilBulgariaBurma/MyanmarCabo VerdeCambodiaCameroonCanadaCaribbeanCentral AmericaChileChinaColombiaCongoCosta RicaCroatiaCubaCzechoslovakiaDenmarkDominicaDominican RepublicEastern AfricaEastern AsiaEastern EuropeEcuadorEgyptEl SalvadorEnglandEritreaEthiopiaEuropeFijiFranceGermanyGhanaGreeceGrenadaGuatemalaGuyanaHaitiHondurasHong KongHungaryIndiaIndonesiaIranIraqIrelandIsraelItalyJamaicaJapanJordanKazakhstanKenyaKoreaKuwaitLaosLatin AmericaLatviaLebanonLiberiaLithuaniaMalaysiaMexicoMicronesiaMiddle AfricaMoldovaMoroccoNepalNetherlandsNicaraguaNigeriaNorth AmericaNorth MacedoniaNorthern AfricaNorthern EuropeNorwayOceaniaPakistanPanamaPeruPhilippinesPolandPortugalRomaniaRussiaSaudi ArabiaScotlandSenegalSerbiaSierra LeoneSingaporeSomaliaSouth AfricaSouth AmericaSouth Central AsiaSouth Eastern AsiaSouthern EuropeSpainSri LankaSt. Vincent and the GrenadinesSudanSwedenSwitzerlandSyriaTaiwanThailandTrinidad and TobagoTurkeyUgandaUkraineUruguayUzbekistanVenezuelaVietnamWest IndiesWestern AfricaWestern AsiaWestern EuropeYemenZaireZimbabweAzores
Immigrants from Afghanistan
Race
Ancestry
AfghanAfricanAlaska NativeAlaskan AthabascanAlbanianAleutAlsatianAmericanApacheArabArapahoArgentineanArmenianAssyrian/Chaldean/SyriacAustralianAustrianBahamianBangladeshiBarbadianBasqueBelgianBelizeanBermudanBhutaneseBlackfeetBolivianBrazilianBritishBritish West IndianBulgarianBurmeseCajunCambodianCanadianCape VerdeanCarpatho RusynCelticCentral AmericanCentral American IndianCherokeeCheyenneChickasawChileanChineseChippewaChoctawColombianColvilleComancheCosta RicanCreeCreekCroatianCrowCubanCypriotCzechCzechoslovakianDanishDelawareDominicanDutchDutch West IndianEastern EuropeanEcuadorianEgyptianEnglishEstonianEthiopianEuropeanFijianFilipinoFinnishFrenchFrench American IndianFrench CanadianGermanGerman RussianGhanaianGreekGuamanian/ChamorroGuatemalanGuyaneseHaitianHmongHonduranHopiHoumaHungarianIcelanderIndian (Asian)IndonesianInupiatIranianIraqiIrishIroquoisIsraeliItalianJamaicanJapaneseJordanianKenyanKiowaKoreanLaotianLatvianLebaneseLiberianLithuanianLumbeeLuxembourgerMacedonianMalaysianMalteseMarshalleseMenomineeMexicanMexican American IndianMongolianMoroccanNative HawaiianNavajoNepaleseNew ZealanderNicaraguanNigerianNorthern EuropeanNorwegianOkinawanOsageOttawaPaiutePakistaniPalestinianPanamanianParaguayanPennsylvania GermanPeruvianPimaPolishPortuguesePotawatomiPuebloPuerto RicanPuget Sound SalishRomanianRussianSalvadoranSamoanScandinavianScotch-IrishScottishSeminoleSenegaleseSerbianShoshoneSierra LeoneanSiouxSlavicSlovakSloveneSomaliSouth AfricanSouth AmericanSouth American IndianSoviet UnionSpaniardSpanishSpanish AmericanSpanish American IndianSri LankanSubsaharan AfricanSudaneseSwedishSwissSyrianTaiwaneseThaiTlingit-HaidaTohono O'OdhamTonganTrinidadian and TobagonianTsimshianTurkishU.S. Virgin IslanderUgandanUkrainianUruguayanUteVenezuelanVietnameseWelshWest IndianYakamaYaquiYugoslavianYumanYup'ikZimbabwean
Immigration
NonimmigrantsImmigrantsAfghanistanAfricaAlbaniaArgentinaArmeniaAsiaAustraliaAustriaBahamasBangladeshBarbadosBelarusBelgiumBelizeBoliviaBosnia and HerzegovinaBrazilBulgariaBurma/MyanmarCabo VerdeCambodiaCameroonCanadaCaribbeanCentral AmericaChileChinaColombiaCongoCosta RicaCroatiaCubaCzechoslovakiaDenmarkDominicaDominican RepublicEastern AfricaEastern AsiaEastern EuropeEcuadorEgyptEl SalvadorEnglandEritreaEthiopiaEuropeFijiFranceGermanyGhanaGreeceGrenadaGuatemalaGuyanaHaitiHondurasHong KongHungaryIndiaIndonesiaIranIraqIrelandIsraelItalyJamaicaJapanJordanKenyaKoreaKuwaitLaosLatin AmericaLatviaLebanonLiberiaLithuaniaMalaysiaMexicoMicronesiaMiddle AfricaMoldovaMoroccoNepalNetherlandsNicaraguaNigeriaNorth AmericaNorth MacedoniaNorthern AfricaNorthern EuropeNorwayOceaniaPakistanPanamaPeruPhilippinesPolandPortugalRomaniaRussiaSaudi ArabiaScotlandSenegalSerbiaSierra LeoneSingaporeSomaliaSouth AfricaSouth AmericaSouth Central AsiaSouth Eastern AsiaSouthern EuropeSpainSri LankaSt. Vincent and the GrenadinesSudanSwedenSwitzerlandSyriaTaiwanThailandTrinidad and TobagoTurkeyUgandaUkraineUruguayUzbekistanVenezuelaVietnamWest IndiesWestern AfricaWestern AsiaWestern EuropeYemenZaireZimbabweAzores
Disability Age 65 to 74
Income
Poverty
Unemployment
Labor Participation
Family Structure
Vehicle Availability
Education Level
Disability

Disability Age 65 to 74 Comparison

Immigrants from Kazakhstan

Immigrants from Afghanistan

Exceptional
Good
22.4%
DISABILITY AGE 65 TO 74
93.9/ 100
METRIC RATING
120th/ 347
METRIC RANK
23.2%
DISABILITY AGE 65 TO 74
60.5/ 100
METRIC RATING
166th/ 347
METRIC RANK

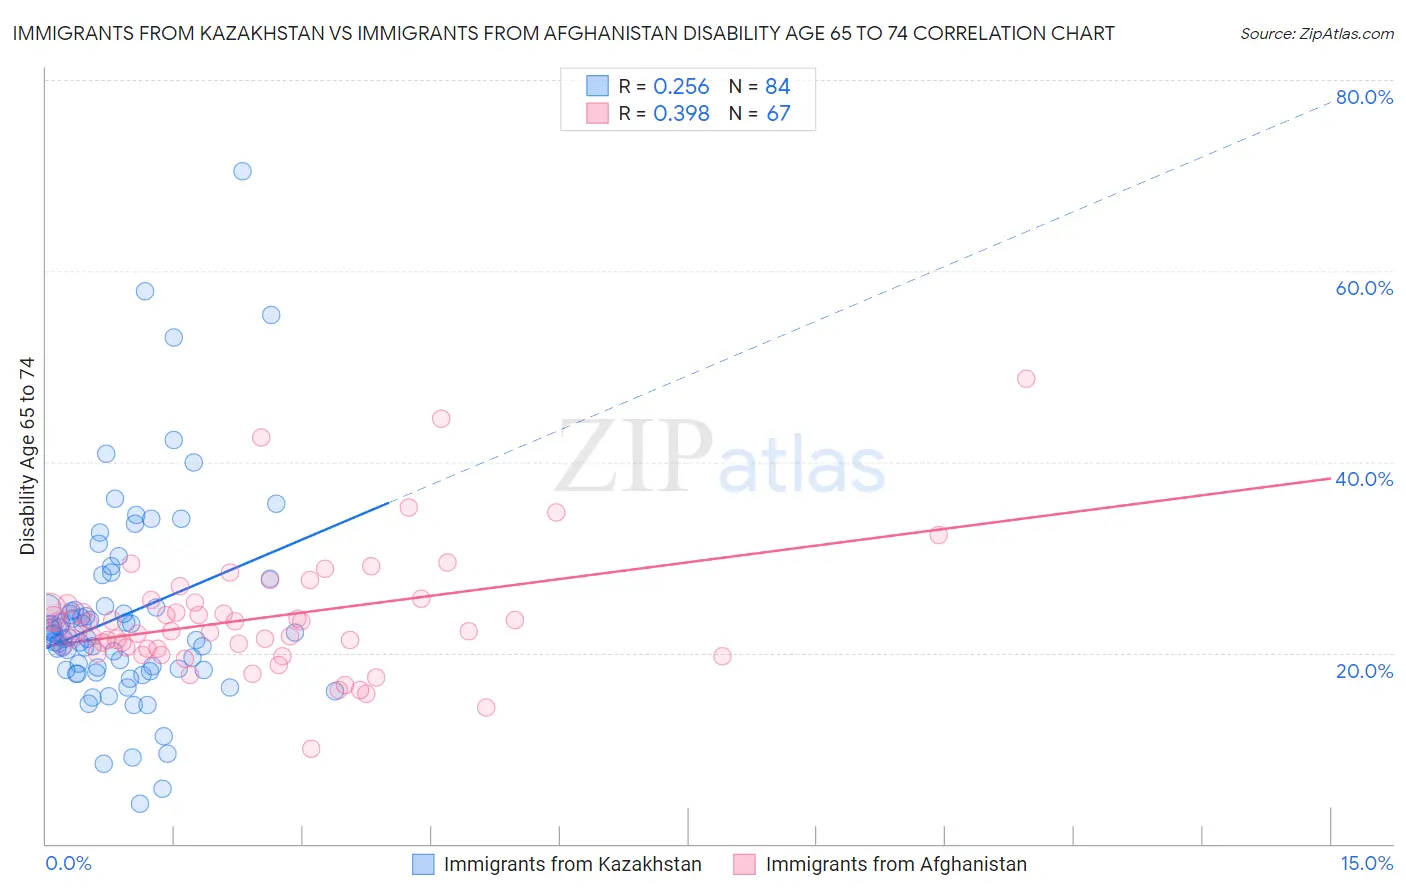
Immigrants from Kazakhstan vs Immigrants from Afghanistan Disability Age 65 to 74 Correlation Chart

The statistical analysis conducted on geographies consisting of 124,413,271 people shows a weak positive correlation between the proportion of Immigrants from Kazakhstan and percentage of population with a disability between the ages 65 and 75 in the United States with a correlation coefficient (R) of 0.256 and weighted average of 22.4%. Similarly, the statistical analysis conducted on geographies consisting of 147,591,650 people shows a mild positive correlation between the proportion of Immigrants from Afghanistan and percentage of population with a disability between the ages 65 and 75 in the United States with a correlation coefficient (R) of 0.398 and weighted average of 23.2%, a difference of 3.5%.
Immigrants from Kazakhstan vs Immigrants from Afghanistan Disability Age 65 to 74

Disability Age 65 to 74 Correlation Summary

MeasurementImmigrants from KazakhstanImmigrants from Afghanistan
Minimum4.3%10.0%
Maximum70.4%48.7%
Range66.1%38.7%
Mean23.9%23.6%
Median21.8%22.3%
Interquartile 25% (IQ1)18.2%20.4%
Interquartile 75% (IQ3)24.8%25.3%
Interquartile Range (IQR)6.6%4.9%
Standard Deviation (Sample)10.8%6.5%
Standard Deviation (Population)10.8%6.4%

Similar Demographics by Disability Age 65 to 74

Demographics Similar to Immigrants from Kazakhstan by Disability Age 65 to 74

In terms of disability age 65 to 74, the demographic groups most similar to Immigrants from Kazakhstan are Czech (22.4%, a difference of 0.10%), Immigrants from Jordan (22.4%, a difference of 0.10%), Hungarian (22.4%, a difference of 0.15%), Immigrants from Northern Africa (22.4%, a difference of 0.22%), and Swedish (22.4%, a difference of 0.23%).
DemographicsRating | RankDisability Age 65 to 74
Syrians
95.3
/100
|
#113
Exceptional
22.3%
Ukrainians
95.1
/100
|
#114
Exceptional
22.3%
Laotians
94.9
/100
|
#115
Exceptional
22.3%
Brazilians
94.8
/100
|
#116
Exceptional
22.4%
Swedes
94.7
/100
|
#117
Exceptional
22.4%
Austrians
94.7
/100
|
#118
Exceptional
22.4%
Immigrants | Northern Africa
94.7
/100
|
#119
Exceptional
22.4%
Immigrants | Kazakhstan
93.9
/100
|
#120
Exceptional
22.4%
Czechs
93.5
/100
|
#121
Exceptional
22.4%
Immigrants | Jordan
93.5
/100
|
#122
Exceptional
22.4%
Hungarians
93.3
/100
|
#123
Exceptional
22.4%
Norwegians
92.5
/100
|
#124
Exceptional
22.5%
Immigrants | Western Europe
92.3
/100
|
#125
Exceptional
22.5%
Lebanese
92.2
/100
|
#126
Exceptional
22.5%
Slovaks
91.6
/100
|
#127
Exceptional
22.5%

Demographics Similar to Immigrants from Afghanistan by Disability Age 65 to 74

In terms of disability age 65 to 74, the demographic groups most similar to Immigrants from Afghanistan are Sierra Leonean (23.2%, a difference of 0.020%), Vietnamese (23.2%, a difference of 0.020%), European (23.2%, a difference of 0.040%), Immigrants from Philippines (23.2%, a difference of 0.040%), and Immigrants from Bosnia and Herzegovina (23.2%, a difference of 0.18%).
DemographicsRating | RankDisability Age 65 to 74
South American Indians
65.5
/100
|
#159
Good
23.1%
Koreans
64.2
/100
|
#160
Good
23.1%
Immigrants | Cameroon
63.8
/100
|
#161
Good
23.1%
Europeans
61.2
/100
|
#162
Good
23.2%
Immigrants | Philippines
61.1
/100
|
#163
Good
23.2%
Sierra Leoneans
60.9
/100
|
#164
Good
23.2%
Vietnamese
60.8
/100
|
#165
Good
23.2%
Immigrants | Afghanistan
60.5
/100
|
#166
Good
23.2%
Immigrants | Bosnia and Herzegovina
57.6
/100
|
#167
Average
23.2%
Pakistanis
57.0
/100
|
#168
Average
23.2%
Icelanders
54.3
/100
|
#169
Average
23.3%
Moroccans
54.2
/100
|
#170
Average
23.3%
Cubans
51.9
/100
|
#171
Average
23.3%
Germans
50.5
/100
|
#172
Average
23.3%
Yugoslavians
50.2
/100
|
#173
Average
23.3%