Immigrants from Kazakhstan vs European Disability Age 18 to 34
COMPARE
Immigrants from Kazakhstan
European
Disability Age 18 to 34
Disability Age 18 to 34 Comparison
Immigrants from Kazakhstan
Europeans
6.2%
DISABILITY AGE 18 TO 34
97.5/ 100
METRIC RATING
94th/ 347
METRIC RANK
7.4%
DISABILITY AGE 18 TO 34
0.1/ 100
METRIC RATING
276th/ 347
METRIC RANK
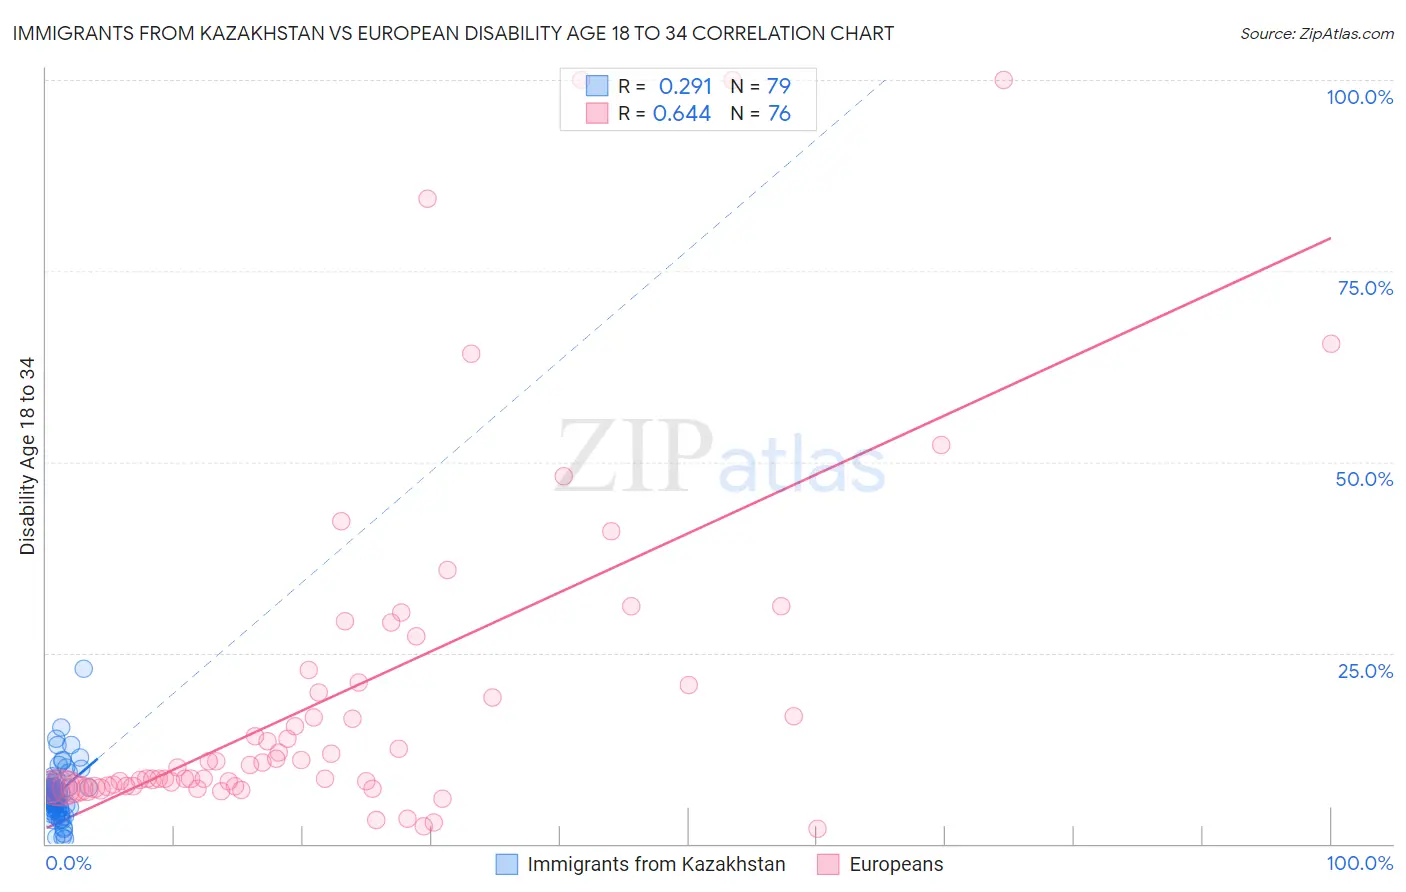
Immigrants from Kazakhstan vs European Disability Age 18 to 34 Correlation Chart
The statistical analysis conducted on geographies consisting of 124,402,603 people shows a weak positive correlation between the proportion of Immigrants from Kazakhstan and percentage of population with a disability between the ages 18 and 35 in the United States with a correlation coefficient (R) of 0.291 and weighted average of 6.2%. Similarly, the statistical analysis conducted on geographies consisting of 556,910,238 people shows a significant positive correlation between the proportion of Europeans and percentage of population with a disability between the ages 18 and 35 in the United States with a correlation coefficient (R) of 0.644 and weighted average of 7.4%, a difference of 19.8%.
Disability Age 18 to 34 Correlation Summary
| Measurement | Immigrants from Kazakhstan | European |
| Minimum | 0.62% | 1.9% |
| Maximum | 23.0% | 100.0% |
| Range | 22.3% | 98.1% |
| Mean | 6.6% | 19.6% |
| Median | 6.2% | 10.1% |
| Interquartile 25% (IQ1) | 4.7% | 7.4% |
| Interquartile 75% (IQ3) | 7.4% | 21.0% |
| Interquartile Range (IQR) | 2.7% | 13.6% |
| Standard Deviation (Sample) | 3.4% | 22.6% |
| Standard Deviation (Population) | 3.4% | 22.4% |
Similar Demographics by Disability Age 18 to 34
Demographics Similar to Immigrants from Kazakhstan by Disability Age 18 to 34
In terms of disability age 18 to 34, the demographic groups most similar to Immigrants from Kazakhstan are Central American (6.2%, a difference of 0.030%), Immigrants (6.2%, a difference of 0.050%), Jordanian (6.2%, a difference of 0.070%), Immigrants from Uruguay (6.2%, a difference of 0.070%), and Immigrants from Philippines (6.2%, a difference of 0.12%).
| Demographics | Rating | Rank | Disability Age 18 to 34 |
| Immigrants | Eastern Europe | 97.9 /100 | #87 | Exceptional 6.2% |
| Cambodians | 97.8 /100 | #88 | Exceptional 6.2% |
| Turks | 97.8 /100 | #89 | Exceptional 6.2% |
| Immigrants | Vietnam | 97.7 /100 | #90 | Exceptional 6.2% |
| Immigrants | Philippines | 97.6 /100 | #91 | Exceptional 6.2% |
| Jordanians | 97.6 /100 | #92 | Exceptional 6.2% |
| Immigrants | Immigrants | 97.6 /100 | #93 | Exceptional 6.2% |
| Immigrants | Kazakhstan | 97.5 /100 | #94 | Exceptional 6.2% |
| Central Americans | 97.5 /100 | #95 | Exceptional 6.2% |
| Immigrants | Uruguay | 97.4 /100 | #96 | Exceptional 6.2% |
| Uruguayans | 97.3 /100 | #97 | Exceptional 6.2% |
| Immigrants | Syria | 97.2 /100 | #98 | Exceptional 6.2% |
| Immigrants | Ethiopia | 96.9 /100 | #99 | Exceptional 6.2% |
| Immigrants | Albania | 96.7 /100 | #100 | Exceptional 6.2% |
| Immigrants | Jamaica | 96.4 /100 | #101 | Exceptional 6.2% |
Demographics Similar to Europeans by Disability Age 18 to 34
In terms of disability age 18 to 34, the demographic groups most similar to Europeans are Immigrants from Somalia (7.4%, a difference of 0.050%), African (7.4%, a difference of 0.12%), Slavic (7.4%, a difference of 0.13%), Tsimshian (7.4%, a difference of 0.18%), and Swiss (7.4%, a difference of 0.27%).
| Demographics | Rating | Rank | Disability Age 18 to 34 |
| Basques | 0.1 /100 | #269 | Tragic 7.4% |
| Belgians | 0.1 /100 | #270 | Tragic 7.4% |
| Swiss | 0.1 /100 | #271 | Tragic 7.4% |
| Tsimshian | 0.1 /100 | #272 | Tragic 7.4% |
| Slavs | 0.1 /100 | #273 | Tragic 7.4% |
| Africans | 0.1 /100 | #274 | Tragic 7.4% |
| Immigrants | Somalia | 0.1 /100 | #275 | Tragic 7.4% |
| Europeans | 0.1 /100 | #276 | Tragic 7.4% |
| Immigrants | Portugal | 0.1 /100 | #277 | Tragic 7.4% |
| Lumbee | 0.1 /100 | #278 | Tragic 7.4% |
| Czechoslovakians | 0.1 /100 | #279 | Tragic 7.4% |
| Yaqui | 0.1 /100 | #280 | Tragic 7.4% |
| Paiute | 0.0 /100 | #281 | Tragic 7.5% |
| Spanish | 0.0 /100 | #282 | Tragic 7.5% |
| Danes | 0.0 /100 | #283 | Tragic 7.5% |