Immigrants from Japan vs Hungarian Disability Age Over 75
COMPARE
Immigrants from Japan
Hungarian
Disability Age Over 75
Disability Age Over 75 Comparison
Immigrants from Japan
Hungarians
46.3%
DISABILITY AGE OVER 75
97.8/ 100
METRIC RATING
98th/ 347
METRIC RANK
46.5%
DISABILITY AGE OVER 75
95.3/ 100
METRIC RATING
117th/ 347
METRIC RANK
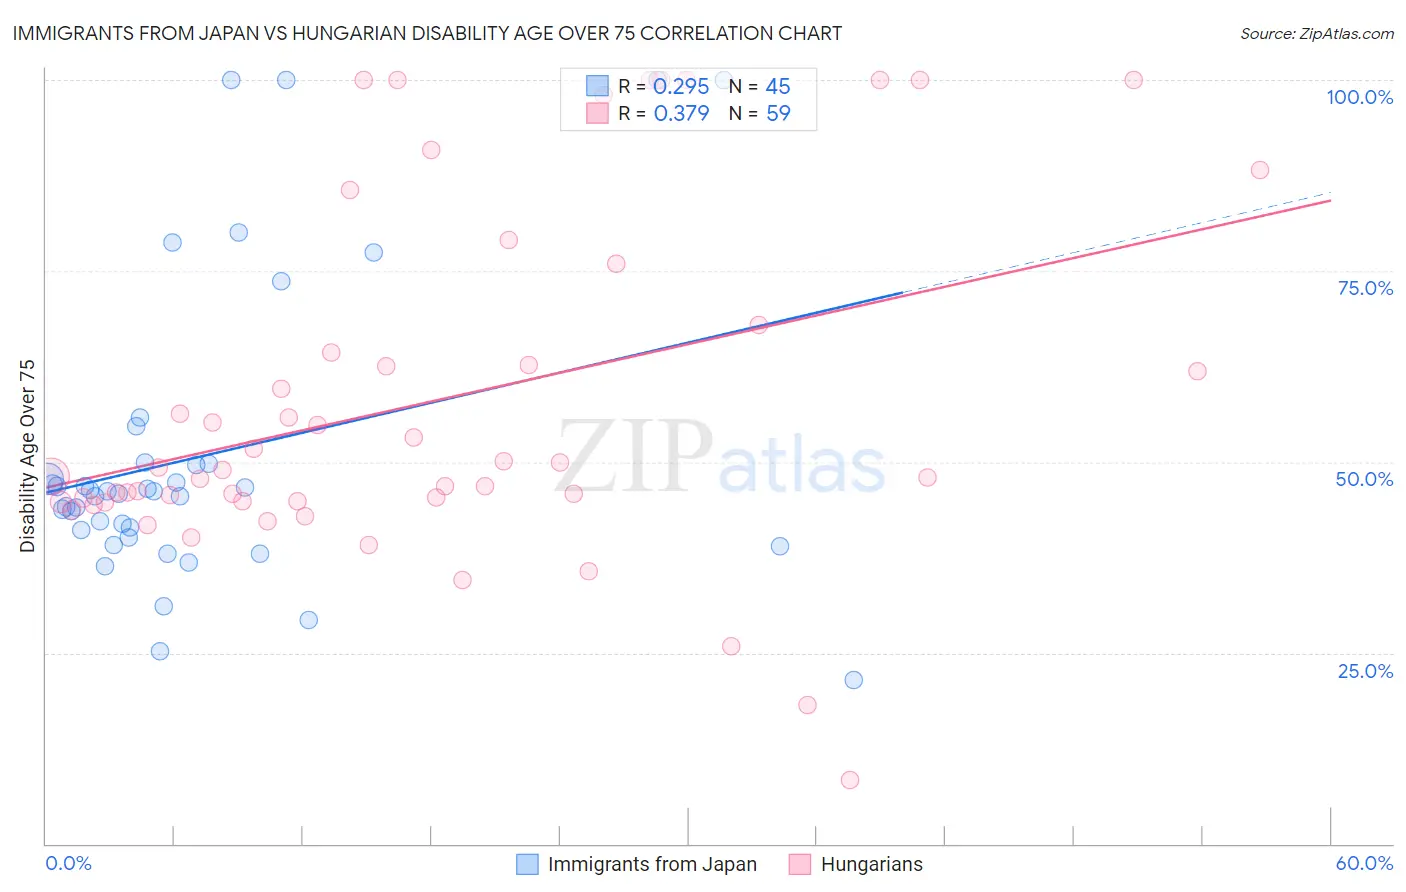
Immigrants from Japan vs Hungarian Disability Age Over 75 Correlation Chart
The statistical analysis conducted on geographies consisting of 339,657,036 people shows a weak positive correlation between the proportion of Immigrants from Japan and percentage of population with a disability over the age of 75 in the United States with a correlation coefficient (R) of 0.295 and weighted average of 46.3%. Similarly, the statistical analysis conducted on geographies consisting of 485,150,017 people shows a mild positive correlation between the proportion of Hungarians and percentage of population with a disability over the age of 75 in the United States with a correlation coefficient (R) of 0.379 and weighted average of 46.5%, a difference of 0.46%.
Disability Age Over 75 Correlation Summary
| Measurement | Immigrants from Japan | Hungarian |
| Minimum | 21.4% | 8.3% |
| Maximum | 100.0% | 100.0% |
| Range | 78.6% | 91.7% |
| Mean | 50.9% | 58.0% |
| Median | 46.1% | 48.9% |
| Interquartile 25% (IQ1) | 40.6% | 44.8% |
| Interquartile 75% (IQ3) | 49.8% | 67.9% |
| Interquartile Range (IQR) | 9.2% | 23.1% |
| Standard Deviation (Sample) | 19.6% | 22.8% |
| Standard Deviation (Population) | 19.4% | 22.6% |
Demographics Similar to Immigrants from Japan and Hungarians by Disability Age Over 75
In terms of disability age over 75, the demographic groups most similar to Immigrants from Japan are Finnish (46.3%, a difference of 0.010%), Palestinian (46.3%, a difference of 0.040%), Immigrants from Eastern Europe (46.3%, a difference of 0.040%), Mongolian (46.3%, a difference of 0.040%), and Immigrants from Malaysia (46.4%, a difference of 0.16%). Similarly, the demographic groups most similar to Hungarians are British (46.5%, a difference of 0.060%), Indian (Asian) (46.5%, a difference of 0.060%), Dutch (46.5%, a difference of 0.080%), Irish (46.5%, a difference of 0.10%), and Immigrants from Pakistan (46.5%, a difference of 0.11%).
| Demographics | Rating | Rank | Disability Age Over 75 |
| Finns | 97.9 /100 | #97 | Exceptional 46.3% |
| Immigrants | Japan | 97.8 /100 | #98 | Exceptional 46.3% |
| Palestinians | 97.7 /100 | #99 | Exceptional 46.3% |
| Immigrants | Eastern Europe | 97.7 /100 | #100 | Exceptional 46.3% |
| Mongolians | 97.7 /100 | #101 | Exceptional 46.3% |
| Immigrants | Malaysia | 97.1 /100 | #102 | Exceptional 46.4% |
| Ukrainians | 97.1 /100 | #103 | Exceptional 46.4% |
| Israelis | 97.0 /100 | #104 | Exceptional 46.4% |
| Immigrants | Cameroon | 96.9 /100 | #105 | Exceptional 46.4% |
| Immigrants | Kuwait | 96.8 /100 | #106 | Exceptional 46.4% |
| Immigrants | Uruguay | 96.7 /100 | #107 | Exceptional 46.4% |
| Brazilians | 96.6 /100 | #108 | Exceptional 46.5% |
| Chileans | 96.4 /100 | #109 | Exceptional 46.5% |
| Immigrants | Hong Kong | 96.4 /100 | #110 | Exceptional 46.5% |
| Immigrants | Chile | 96.4 /100 | #111 | Exceptional 46.5% |
| Immigrants | Pakistan | 96.1 /100 | #112 | Exceptional 46.5% |
| Irish | 96.0 /100 | #113 | Exceptional 46.5% |
| Dutch | 95.9 /100 | #114 | Exceptional 46.5% |
| British | 95.7 /100 | #115 | Exceptional 46.5% |
| Indians (Asian) | 95.7 /100 | #116 | Exceptional 46.5% |
| Hungarians | 95.3 /100 | #117 | Exceptional 46.5% |