Immigrants from Jamaica vs Okinawan Disability Age Over 75

COMPARE

Immigrants from Jamaica
Race
Ancestry
AfghanAfricanAlaska NativeAlaskan AthabascanAlbanianAleutAlsatianAmericanApacheArabArapahoArgentineanArmenianAssyrian/Chaldean/SyriacAustralianAustrianBahamianBangladeshiBarbadianBasqueBelgianBelizeanBermudanBhutaneseBlackfeetBolivianBrazilianBritishBritish West IndianBulgarianBurmeseCajunCambodianCanadianCape VerdeanCarpatho RusynCelticCentral AmericanCentral American IndianCherokeeCheyenneChickasawChileanChineseChippewaChoctawColombianColvilleComancheCosta RicanCreeCreekCroatianCrowCubanCypriotCzechCzechoslovakianDanishDelawareDominicanDutchDutch West IndianEastern EuropeanEcuadorianEgyptianEnglishEstonianEthiopianEuropeanFijianFilipinoFinnishFrenchFrench American IndianFrench CanadianGermanGerman RussianGhanaianGreekGuamanian/ChamorroGuatemalanGuyaneseHaitianHmongHonduranHopiHoumaHungarianIcelanderIndian (Asian)IndonesianInupiatIranianIraqiIrishIroquoisIsraeliItalianJamaicanJapaneseJordanianKenyanKiowaKoreanLaotianLatvianLebaneseLiberianLithuanianLumbeeLuxembourgerMacedonianMalaysianMalteseMarshalleseMenomineeMexicanMexican American IndianMongolianMoroccanNative HawaiianNavajoNepaleseNew ZealanderNicaraguanNigerianNorthern EuropeanNorwegianOsageOttawaPaiutePakistaniPalestinianPanamanianParaguayanPennsylvania GermanPeruvianPimaPolishPortuguesePotawatomiPuebloPuerto RicanPuget Sound SalishRomanianRussianSalvadoranSamoanScandinavianScotch-IrishScottishSeminoleSenegaleseSerbianShoshoneSierra LeoneanSiouxSlavicSlovakSloveneSomaliSouth AfricanSouth AmericanSouth American IndianSoviet UnionSpaniardSpanishSpanish AmericanSpanish American IndianSri LankanSubsaharan AfricanSudaneseSwedishSwissSyrianTaiwaneseThaiTlingit-HaidaTohono O'OdhamTonganTrinidadian and TobagonianTsimshianTurkishU.S. Virgin IslanderUgandanUkrainianUruguayanUteVenezuelanVietnameseWelshWest IndianYakamaYaquiYugoslavianYumanYup'ikZimbabwean
Immigration
NonimmigrantsImmigrantsAfghanistanAfricaAlbaniaArgentinaArmeniaAsiaAustraliaAustriaBahamasBangladeshBarbadosBelarusBelgiumBelizeBoliviaBosnia and HerzegovinaBrazilBulgariaBurma/MyanmarCabo VerdeCambodiaCameroonCanadaCaribbeanCentral AmericaChileChinaColombiaCongoCosta RicaCroatiaCubaCzechoslovakiaDenmarkDominicaDominican RepublicEastern AfricaEastern AsiaEastern EuropeEcuadorEgyptEl SalvadorEnglandEritreaEthiopiaEuropeFijiFranceGermanyGhanaGreeceGrenadaGuatemalaGuyanaHaitiHondurasHong KongHungaryIndiaIndonesiaIranIraqIrelandIsraelItalyJamaicaJapanJordanKazakhstanKenyaKoreaKuwaitLaosLatin AmericaLatviaLebanonLiberiaLithuaniaMalaysiaMexicoMicronesiaMiddle AfricaMoldovaMoroccoNepalNetherlandsNicaraguaNigeriaNorth AmericaNorth MacedoniaNorthern AfricaNorthern EuropeNorwayOceaniaPakistanPanamaPeruPhilippinesPolandPortugalRomaniaRussiaSaudi ArabiaScotlandSenegalSerbiaSierra LeoneSingaporeSomaliaSouth AfricaSouth AmericaSouth Central AsiaSouth Eastern AsiaSouthern EuropeSpainSri LankaSt. Vincent and the GrenadinesSudanSwedenSwitzerlandSyriaTaiwanThailandTrinidad and TobagoTurkeyUgandaUkraineUruguayUzbekistanVenezuelaVietnamWest IndiesWestern AfricaWestern AsiaWestern EuropeYemenZaireZimbabweAzores
Okinawan
Race
Ancestry
AfghanAfricanAlaska NativeAlaskan AthabascanAlbanianAleutAlsatianAmericanApacheArabArapahoArgentineanArmenianAssyrian/Chaldean/SyriacAustralianAustrianBahamianBangladeshiBarbadianBasqueBelgianBelizeanBermudanBhutaneseBlackfeetBolivianBrazilianBritishBritish West IndianBulgarianBurmeseCajunCambodianCanadianCape VerdeanCarpatho RusynCelticCentral AmericanCentral American IndianCherokeeCheyenneChickasawChileanChineseChippewaChoctawColombianColvilleComancheCosta RicanCreeCreekCroatianCrowCubanCypriotCzechCzechoslovakianDanishDelawareDominicanDutchDutch West IndianEastern EuropeanEcuadorianEgyptianEnglishEstonianEthiopianEuropeanFijianFilipinoFinnishFrenchFrench American IndianFrench CanadianGermanGerman RussianGhanaianGreekGuamanian/ChamorroGuatemalanGuyaneseHaitianHmongHonduranHopiHoumaHungarianIcelanderIndian (Asian)IndonesianInupiatIranianIraqiIrishIroquoisIsraeliItalianJamaicanJapaneseJordanianKenyanKiowaKoreanLaotianLatvianLebaneseLiberianLithuanianLumbeeLuxembourgerMacedonianMalaysianMalteseMarshalleseMenomineeMexicanMexican American IndianMongolianMoroccanNative HawaiianNavajoNepaleseNew ZealanderNicaraguanNigerianNorthern EuropeanNorwegianOkinawanOsageOttawaPaiutePakistaniPalestinianPanamanianParaguayanPennsylvania GermanPeruvianPimaPolishPortuguesePotawatomiPuebloPuerto RicanPuget Sound SalishRomanianRussianSalvadoranSamoanScandinavianScotch-IrishScottishSeminoleSenegaleseSerbianShoshoneSierra LeoneanSiouxSlavicSlovakSloveneSomaliSouth AfricanSouth AmericanSouth American IndianSoviet UnionSpaniardSpanishSpanish AmericanSpanish American IndianSri LankanSubsaharan AfricanSudaneseSwedishSwissSyrianTaiwaneseThaiTlingit-HaidaTohono O'OdhamTonganTrinidadian and TobagonianTsimshianTurkishU.S. Virgin IslanderUgandanUkrainianUruguayanUteVenezuelanVietnameseWelshWest IndianYakamaYaquiYugoslavianYumanYup'ikZimbabwean
Immigration
NonimmigrantsImmigrantsAfghanistanAfricaAlbaniaArgentinaArmeniaAsiaAustraliaAustriaBahamasBangladeshBarbadosBelarusBelgiumBelizeBoliviaBosnia and HerzegovinaBrazilBulgariaBurma/MyanmarCabo VerdeCambodiaCameroonCanadaCaribbeanCentral AmericaChileChinaColombiaCongoCosta RicaCroatiaCubaCzechoslovakiaDenmarkDominicaDominican RepublicEastern AfricaEastern AsiaEastern EuropeEcuadorEgyptEl SalvadorEnglandEritreaEthiopiaEuropeFijiFranceGermanyGhanaGreeceGrenadaGuatemalaGuyanaHaitiHondurasHong KongHungaryIndiaIndonesiaIranIraqIrelandIsraelItalyJapanJordanKazakhstanKenyaKoreaKuwaitLaosLatin AmericaLatviaLebanonLiberiaLithuaniaMalaysiaMexicoMicronesiaMiddle AfricaMoldovaMoroccoNepalNetherlandsNicaraguaNigeriaNorth AmericaNorth MacedoniaNorthern AfricaNorthern EuropeNorwayOceaniaPakistanPanamaPeruPhilippinesPolandPortugalRomaniaRussiaSaudi ArabiaScotlandSenegalSerbiaSierra LeoneSingaporeSomaliaSouth AfricaSouth AmericaSouth Central AsiaSouth Eastern AsiaSouthern EuropeSpainSri LankaSt. Vincent and the GrenadinesSudanSwedenSwitzerlandSyriaTaiwanThailandTrinidad and TobagoTurkeyUgandaUkraineUruguayUzbekistanVenezuelaVietnamWest IndiesWestern AfricaWestern AsiaWestern EuropeYemenZaireZimbabweAzores
Disability Age Over 75
Income
Poverty
Unemployment
Labor Participation
Family Structure
Vehicle Availability
Education Level
Disability

Disability Age Over 75 Comparison

Immigrants from Jamaica

Okinawans

Fair
Exceptional
47.6%
DISABILITY AGE OVER 75
28.3/ 100
METRIC RATING
192nd/ 347
METRIC RANK
44.9%
DISABILITY AGE OVER 75
100.0/ 100
METRIC RATING
7th/ 347
METRIC RANK

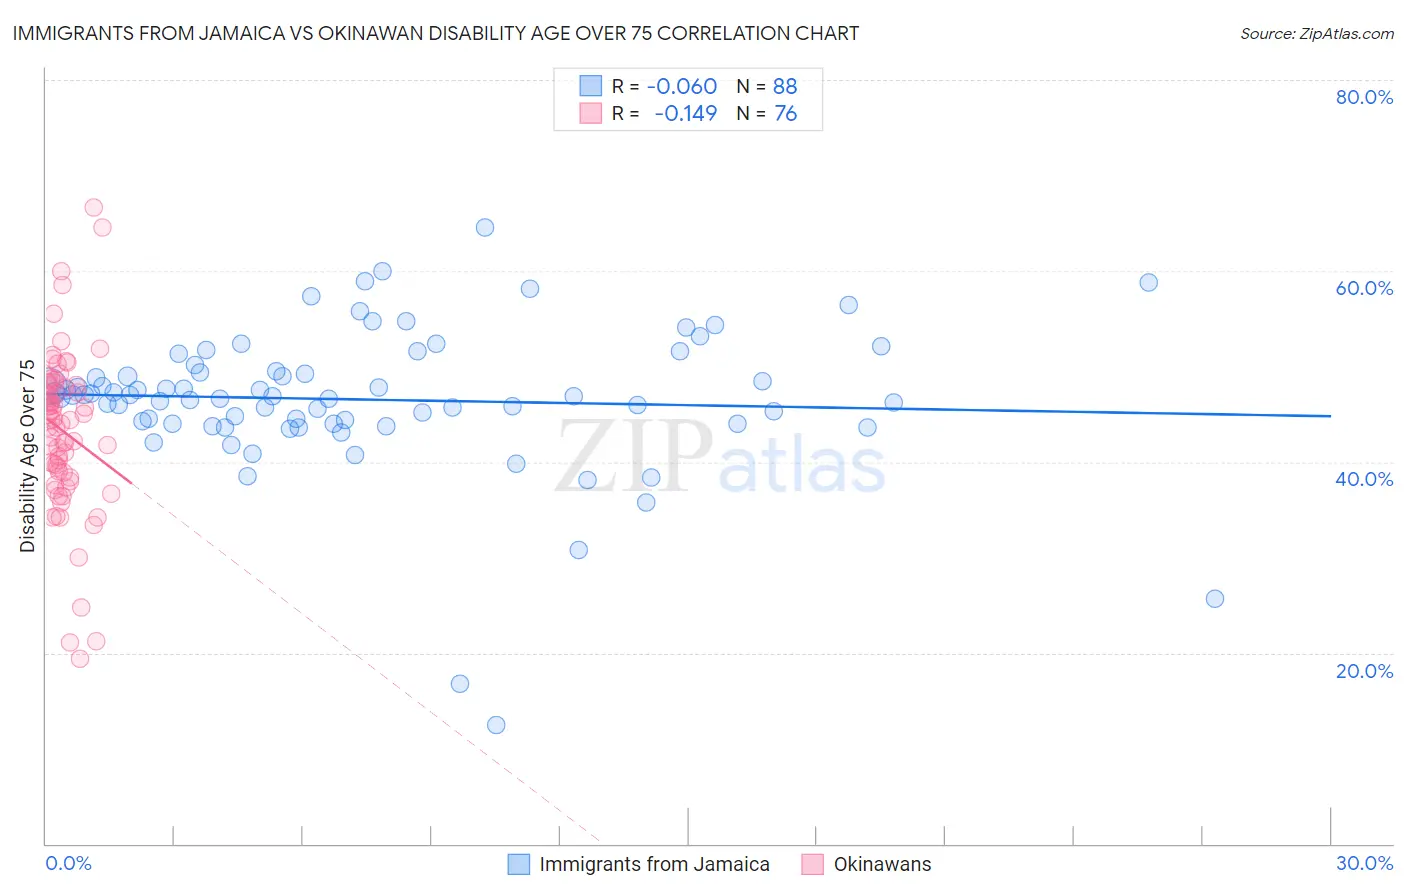
Immigrants from Jamaica vs Okinawan Disability Age Over 75 Correlation Chart

The statistical analysis conducted on geographies consisting of 301,075,213 people shows a slight negative correlation between the proportion of Immigrants from Jamaica and percentage of population with a disability over the age of 75 in the United States with a correlation coefficient (R) of -0.060 and weighted average of 47.6%. Similarly, the statistical analysis conducted on geographies consisting of 73,696,171 people shows a poor negative correlation between the proportion of Okinawans and percentage of population with a disability over the age of 75 in the United States with a correlation coefficient (R) of -0.149 and weighted average of 44.9%, a difference of 6.0%.
Immigrants from Jamaica vs Okinawan Disability Age Over 75

Disability Age Over 75 Correlation Summary

MeasurementImmigrants from JamaicaOkinawan
Minimum12.5%19.4%
Maximum64.6%66.7%
Range52.1%47.2%
Mean46.5%43.2%
Median46.9%44.2%
Interquartile 25% (IQ1)44.1%38.6%
Interquartile 75% (IQ3)49.4%48.1%
Interquartile Range (IQR)5.4%9.5%
Standard Deviation (Sample)7.7%8.5%
Standard Deviation (Population)7.6%8.5%

Similar Demographics by Disability Age Over 75

Demographics Similar to Immigrants from Jamaica by Disability Age Over 75

In terms of disability age over 75, the demographic groups most similar to Immigrants from Jamaica are Ottawa (47.6%, a difference of 0.0%), Somali (47.6%, a difference of 0.030%), Portuguese (47.6%, a difference of 0.030%), Immigrants from Lebanon (47.6%, a difference of 0.050%), and Basque (47.6%, a difference of 0.070%).
DemographicsRating | RankDisability Age Over 75
Ghanaians
33.0
/100
|
#185
Fair
47.5%
Sudanese
32.0
/100
|
#186
Fair
47.5%
Immigrants | Sudan
31.8
/100
|
#187
Fair
47.5%
Basques
30.9
/100
|
#188
Fair
47.6%
Immigrants | Kenya
30.8
/100
|
#189
Fair
47.6%
Somalis
29.5
/100
|
#190
Fair
47.6%
Portuguese
29.3
/100
|
#191
Fair
47.6%
Immigrants | Jamaica
28.3
/100
|
#192
Fair
47.6%
Ottawa
28.1
/100
|
#193
Fair
47.6%
Immigrants | Lebanon
26.5
/100
|
#194
Fair
47.6%
Immigrants | Trinidad and Tobago
25.3
/100
|
#195
Fair
47.6%
Immigrants | Portugal
23.8
/100
|
#196
Fair
47.6%
Pakistanis
23.4
/100
|
#197
Fair
47.7%
Immigrants | Ukraine
23.2
/100
|
#198
Fair
47.7%
Immigrants | Eritrea
22.4
/100
|
#199
Fair
47.7%

Demographics Similar to Okinawans by Disability Age Over 75

In terms of disability age over 75, the demographic groups most similar to Okinawans are Immigrants from Lithuania (44.9%, a difference of 0.040%), Immigrants from Austria (44.9%, a difference of 0.12%), Luxembourger (44.8%, a difference of 0.13%), Carpatho Rusyn (44.8%, a difference of 0.19%), and Paraguayan (45.0%, a difference of 0.20%).
DemographicsRating | RankDisability Age Over 75
Cypriots
100.0
/100
|
#1
Exceptional
43.5%
Immigrants | Ireland
100.0
/100
|
#2
Exceptional
44.7%
Eastern Europeans
100.0
/100
|
#3
Exceptional
44.8%
Carpatho Rusyns
100.0
/100
|
#4
Exceptional
44.8%
Luxembourgers
100.0
/100
|
#5
Exceptional
44.8%
Immigrants | Lithuania
100.0
/100
|
#6
Exceptional
44.9%
Okinawans
100.0
/100
|
#7
Exceptional
44.9%
Immigrants | Austria
100.0
/100
|
#8
Exceptional
44.9%
Paraguayans
100.0
/100
|
#9
Exceptional
45.0%
Bulgarians
100.0
/100
|
#10
Exceptional
45.1%
Lithuanians
100.0
/100
|
#11
Exceptional
45.1%
Immigrants | Czechoslovakia
100.0
/100
|
#12
Exceptional
45.1%
Latvians
100.0
/100
|
#13
Exceptional
45.1%
Immigrants | Scotland
100.0
/100
|
#14
Exceptional
45.1%
Immigrants | Sweden
100.0
/100
|
#15
Exceptional
45.1%