Immigrants from Iraq vs Indonesian Vision Disability
COMPARE
Immigrants from Iraq
Indonesian
Vision Disability
Vision Disability Comparison
Immigrants from Iraq
Indonesians
2.1%
VISION DISABILITY
64.8/ 100
METRIC RATING
165th/ 347
METRIC RANK
2.2%
VISION DISABILITY
9.5/ 100
METRIC RATING
211th/ 347
METRIC RANK
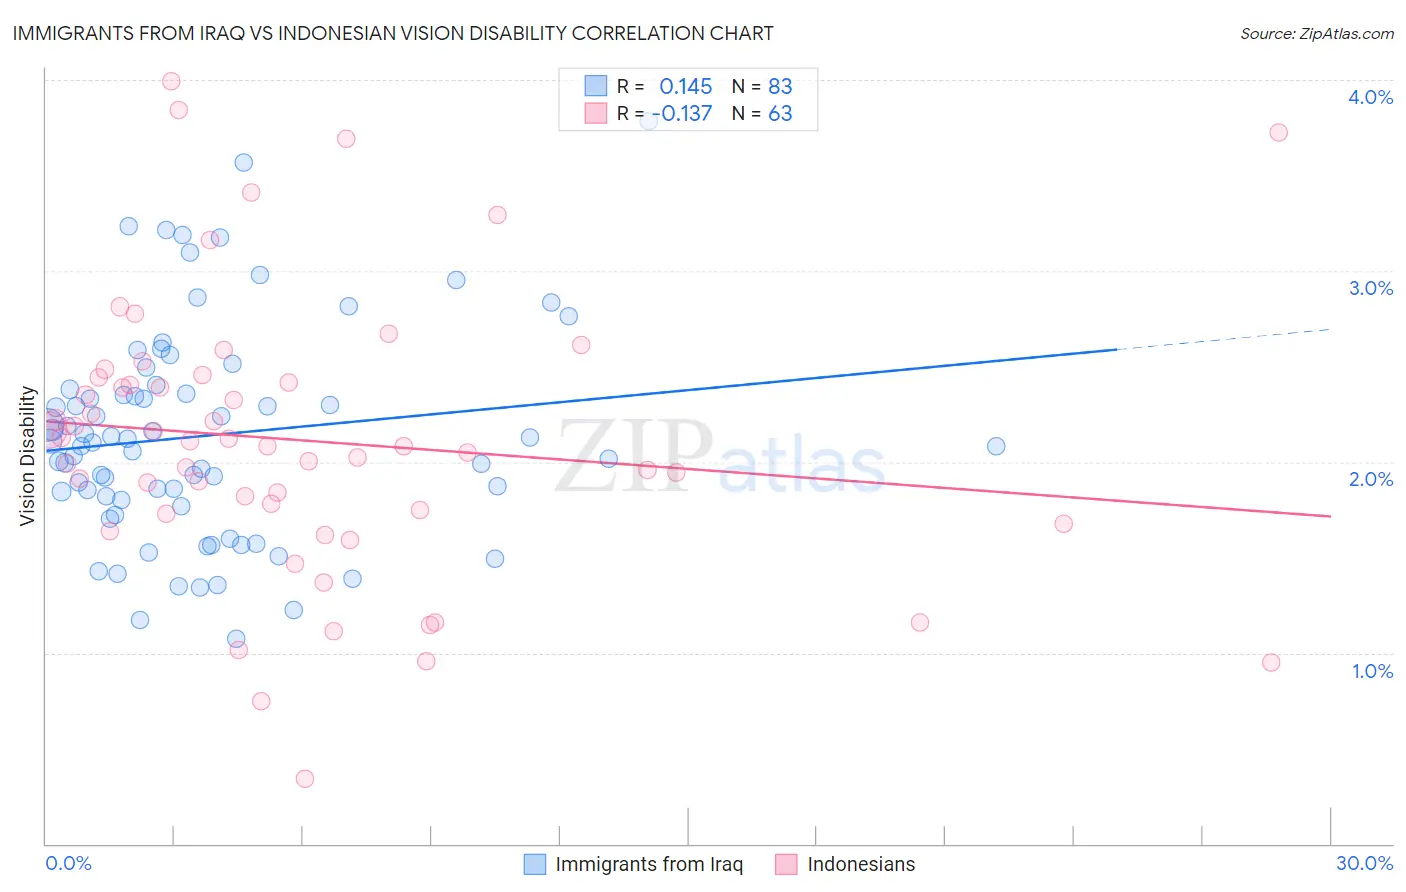
Immigrants from Iraq vs Indonesian Vision Disability Correlation Chart
The statistical analysis conducted on geographies consisting of 194,736,421 people shows a poor positive correlation between the proportion of Immigrants from Iraq and percentage of population with vision disability in the United States with a correlation coefficient (R) of 0.145 and weighted average of 2.1%. Similarly, the statistical analysis conducted on geographies consisting of 162,708,643 people shows a poor negative correlation between the proportion of Indonesians and percentage of population with vision disability in the United States with a correlation coefficient (R) of -0.137 and weighted average of 2.2%, a difference of 4.6%.
Vision Disability Correlation Summary
| Measurement | Immigrants from Iraq | Indonesian |
| Minimum | 1.1% | 0.34% |
| Maximum | 3.8% | 4.0% |
| Range | 2.7% | 3.7% |
| Mean | 2.1% | 2.1% |
| Median | 2.1% | 2.1% |
| Interquartile 25% (IQ1) | 1.8% | 1.7% |
| Interquartile 75% (IQ3) | 2.4% | 2.4% |
| Interquartile Range (IQR) | 0.58% | 0.71% |
| Standard Deviation (Sample) | 0.56% | 0.74% |
| Standard Deviation (Population) | 0.56% | 0.73% |
Similar Demographics by Vision Disability
Demographics Similar to Immigrants from Iraq by Vision Disability
In terms of vision disability, the demographic groups most similar to Immigrants from Iraq are Immigrants from Bangladesh (2.1%, a difference of 0.050%), Icelander (2.1%, a difference of 0.090%), Immigrants from England (2.1%, a difference of 0.14%), Immigrants from Africa (2.1%, a difference of 0.15%), and Hungarian (2.1%, a difference of 0.18%).
| Demographics | Rating | Rank | Vision Disability |
| Immigrants | Uzbekistan | 69.9 /100 | #158 | Good 2.1% |
| South Africans | 69.8 /100 | #159 | Good 2.1% |
| Austrians | 69.0 /100 | #160 | Good 2.1% |
| Iraqis | 67.7 /100 | #161 | Good 2.1% |
| Hungarians | 67.4 /100 | #162 | Good 2.1% |
| Icelanders | 66.1 /100 | #163 | Good 2.1% |
| Immigrants | Bangladesh | 65.5 /100 | #164 | Good 2.1% |
| Immigrants | Iraq | 64.8 /100 | #165 | Good 2.1% |
| Immigrants | England | 62.8 /100 | #166 | Good 2.1% |
| Immigrants | Africa | 62.6 /100 | #167 | Good 2.1% |
| Brazilians | 62.2 /100 | #168 | Good 2.1% |
| South American Indians | 57.4 /100 | #169 | Average 2.2% |
| Swiss | 55.7 /100 | #170 | Average 2.2% |
| Lebanese | 54.3 /100 | #171 | Average 2.2% |
| Northern Europeans | 50.1 /100 | #172 | Average 2.2% |
Demographics Similar to Indonesians by Vision Disability
In terms of vision disability, the demographic groups most similar to Indonesians are Bermudan (2.2%, a difference of 0.090%), Immigrants from Ghana (2.2%, a difference of 0.10%), Trinidadian and Tobagonian (2.2%, a difference of 0.23%), Immigrants from Uruguay (2.2%, a difference of 0.34%), and Nigerian (2.3%, a difference of 0.44%).
| Demographics | Rating | Rank | Vision Disability |
| Immigrants | Guyana | 15.9 /100 | #204 | Poor 2.2% |
| Samoans | 15.7 /100 | #205 | Poor 2.2% |
| Pennsylvania Germans | 14.5 /100 | #206 | Poor 2.2% |
| Immigrants | Nigeria | 13.5 /100 | #207 | Poor 2.2% |
| Germans | 13.4 /100 | #208 | Poor 2.2% |
| Immigrants | Brazil | 13.1 /100 | #209 | Poor 2.2% |
| Immigrants | Uruguay | 11.5 /100 | #210 | Poor 2.2% |
| Indonesians | 9.5 /100 | #211 | Tragic 2.2% |
| Bermudans | 9.0 /100 | #212 | Tragic 2.2% |
| Immigrants | Ghana | 8.9 /100 | #213 | Tragic 2.2% |
| Trinidadians and Tobagonians | 8.2 /100 | #214 | Tragic 2.2% |
| Nigerians | 7.2 /100 | #215 | Tragic 2.3% |
| Immigrants | Trinidad and Tobago | 6.1 /100 | #216 | Tragic 2.3% |
| Barbadians | 5.1 /100 | #217 | Tragic 2.3% |
| Portuguese | 4.9 /100 | #218 | Tragic 2.3% |