Immigrants from Iraq vs Immigrants from St. Vincent and the Grenadines Hearing Disability
COMPARE
Immigrants from Iraq
Immigrants from St. Vincent and the Grenadines
Hearing Disability
Hearing Disability Comparison
Immigrants from Iraq
Immigrants from St. Vincent and the Grenadines
3.1%
HEARING DISABILITY
10.5/ 100
METRIC RATING
213th/ 347
METRIC RANK
2.3%
HEARING DISABILITY
100.0/ 100
METRIC RATING
2nd/ 347
METRIC RANK
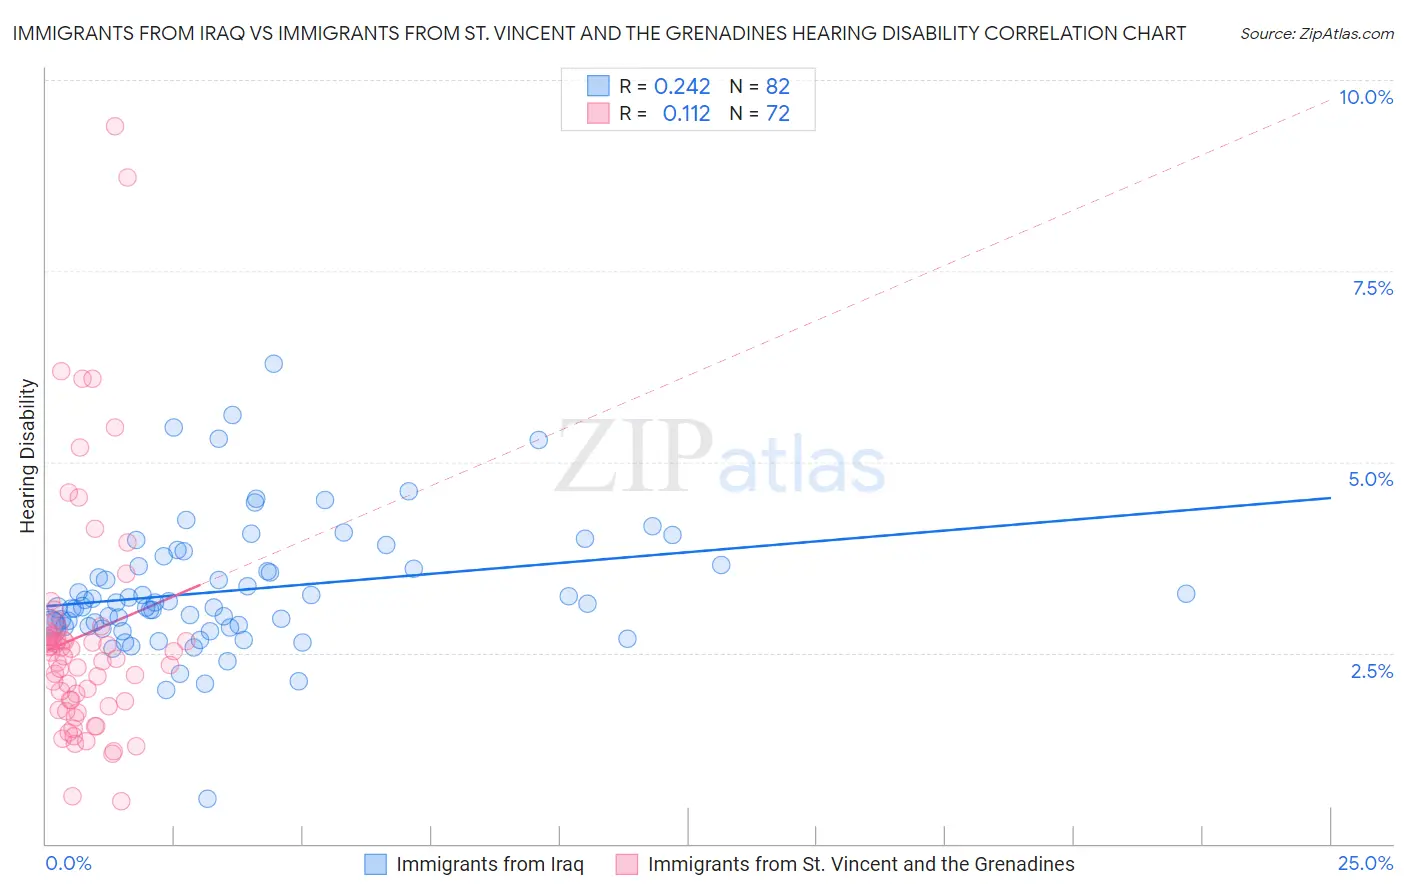
Immigrants from Iraq vs Immigrants from St. Vincent and the Grenadines Hearing Disability Correlation Chart
The statistical analysis conducted on geographies consisting of 194,749,544 people shows a weak positive correlation between the proportion of Immigrants from Iraq and percentage of population with hearing disability in the United States with a correlation coefficient (R) of 0.242 and weighted average of 3.1%. Similarly, the statistical analysis conducted on geographies consisting of 56,191,352 people shows a poor positive correlation between the proportion of Immigrants from St. Vincent and the Grenadines and percentage of population with hearing disability in the United States with a correlation coefficient (R) of 0.112 and weighted average of 2.3%, a difference of 39.5%.
Hearing Disability Correlation Summary
| Measurement | Immigrants from Iraq | Immigrants from St. Vincent and the Grenadines |
| Minimum | 0.59% | 0.55% |
| Maximum | 6.3% | 9.4% |
| Range | 5.7% | 8.8% |
| Mean | 3.3% | 2.7% |
| Median | 3.1% | 2.5% |
| Interquartile 25% (IQ1) | 2.8% | 1.8% |
| Interquartile 75% (IQ3) | 3.6% | 2.8% |
| Interquartile Range (IQR) | 0.81% | 0.93% |
| Standard Deviation (Sample) | 0.86% | 1.6% |
| Standard Deviation (Population) | 0.86% | 1.6% |
Similar Demographics by Hearing Disability
Demographics Similar to Immigrants from Iraq by Hearing Disability
In terms of hearing disability, the demographic groups most similar to Immigrants from Iraq are Pakistani (3.1%, a difference of 0.15%), Romanian (3.1%, a difference of 0.36%), Cape Verdean (3.1%, a difference of 0.39%), Immigrants from Hungary (3.1%, a difference of 0.44%), and Immigrants from Latvia (3.1%, a difference of 0.48%).
| Demographics | Rating | Rank | Hearing Disability |
| Eastern Europeans | 15.5 /100 | #206 | Poor 3.1% |
| Hispanics or Latinos | 15.1 /100 | #207 | Poor 3.1% |
| Immigrants | Latvia | 12.7 /100 | #208 | Poor 3.1% |
| Immigrants | Hungary | 12.5 /100 | #209 | Poor 3.1% |
| Cape Verdeans | 12.2 /100 | #210 | Poor 3.1% |
| Romanians | 12.1 /100 | #211 | Poor 3.1% |
| Pakistanis | 11.1 /100 | #212 | Poor 3.1% |
| Immigrants | Iraq | 10.5 /100 | #213 | Poor 3.1% |
| Australians | 8.1 /100 | #214 | Tragic 3.2% |
| Bangladeshis | 8.1 /100 | #215 | Tragic 3.2% |
| Immigrants | Norway | 7.3 /100 | #216 | Tragic 3.2% |
| Russians | 7.1 /100 | #217 | Tragic 3.2% |
| Immigrants | Northern Europe | 7.0 /100 | #218 | Tragic 3.2% |
| New Zealanders | 6.8 /100 | #219 | Tragic 3.2% |
| Malaysians | 6.6 /100 | #220 | Tragic 3.2% |
Demographics Similar to Immigrants from St. Vincent and the Grenadines by Hearing Disability
In terms of hearing disability, the demographic groups most similar to Immigrants from St. Vincent and the Grenadines are Guyanese (2.3%, a difference of 1.4%), Immigrants from Guyana (2.3%, a difference of 2.8%), Immigrants from Grenada (2.2%, a difference of 2.9%), Immigrants from Barbados (2.4%, a difference of 4.8%), and Vietnamese (2.4%, a difference of 5.9%).
| Demographics | Rating | Rank | Hearing Disability |
| Immigrants | Grenada | 100.0 /100 | #1 | Exceptional 2.2% |
| Immigrants | St. Vincent and the Grenadines | 100.0 /100 | #2 | Exceptional 2.3% |
| Guyanese | 100.0 /100 | #3 | Exceptional 2.3% |
| Immigrants | Guyana | 100.0 /100 | #4 | Exceptional 2.3% |
| Immigrants | Barbados | 100.0 /100 | #5 | Exceptional 2.4% |
| Vietnamese | 100.0 /100 | #6 | Exceptional 2.4% |
| Immigrants | Bangladesh | 100.0 /100 | #7 | Exceptional 2.4% |
| British West Indians | 100.0 /100 | #8 | Exceptional 2.4% |
| Immigrants | Dominican Republic | 100.0 /100 | #9 | Exceptional 2.4% |
| Immigrants | Ecuador | 99.9 /100 | #10 | Exceptional 2.5% |
| Immigrants | Trinidad and Tobago | 99.9 /100 | #11 | Exceptional 2.5% |
| Trinidadians and Tobagonians | 99.9 /100 | #12 | Exceptional 2.5% |
| Sierra Leoneans | 99.9 /100 | #13 | Exceptional 2.5% |
| Ecuadorians | 99.9 /100 | #14 | Exceptional 2.5% |
| Barbadians | 99.9 /100 | #15 | Exceptional 2.5% |