Immigrants from India vs Immigrants from Portugal Vision Disability
COMPARE
Immigrants from India
Immigrants from Portugal
Vision Disability
Vision Disability Comparison
Immigrants from India
Immigrants from Portugal
1.7%
VISION DISABILITY
100.0/ 100
METRIC RATING
1st/ 347
METRIC RANK
2.3%
VISION DISABILITY
1.4/ 100
METRIC RATING
237th/ 347
METRIC RANK
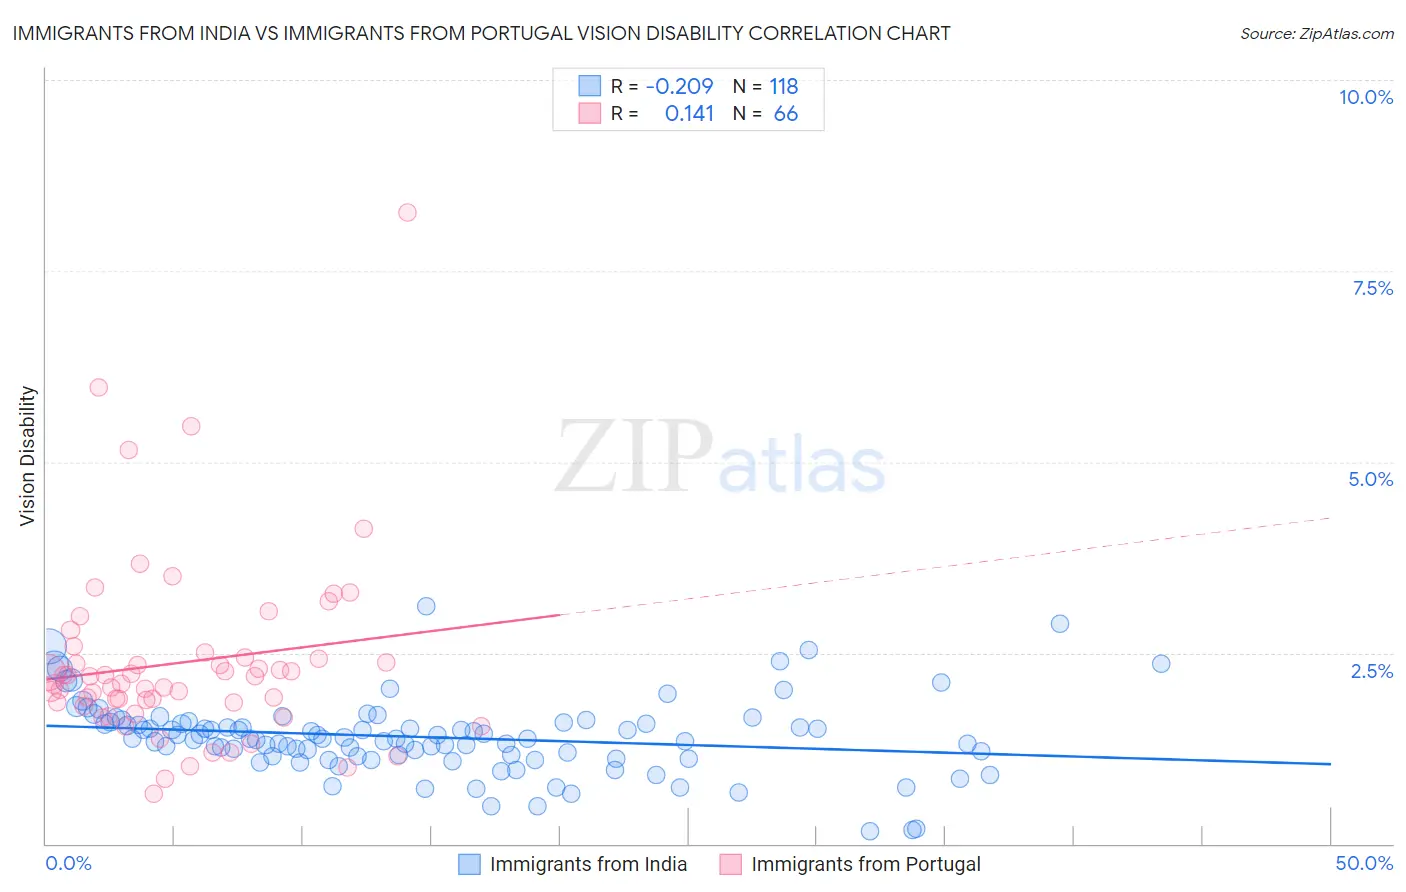
Immigrants from India vs Immigrants from Portugal Vision Disability Correlation Chart
The statistical analysis conducted on geographies consisting of 433,750,609 people shows a weak negative correlation between the proportion of Immigrants from India and percentage of population with vision disability in the United States with a correlation coefficient (R) of -0.209 and weighted average of 1.7%. Similarly, the statistical analysis conducted on geographies consisting of 174,661,842 people shows a poor positive correlation between the proportion of Immigrants from Portugal and percentage of population with vision disability in the United States with a correlation coefficient (R) of 0.141 and weighted average of 2.3%, a difference of 37.3%.
Vision Disability Correlation Summary
| Measurement | Immigrants from India | Immigrants from Portugal |
| Minimum | 0.17% | 0.66% |
| Maximum | 3.1% | 8.3% |
| Range | 2.9% | 7.6% |
| Mean | 1.4% | 2.4% |
| Median | 1.4% | 2.1% |
| Interquartile 25% (IQ1) | 1.2% | 1.8% |
| Interquartile 75% (IQ3) | 1.6% | 2.4% |
| Interquartile Range (IQR) | 0.43% | 0.59% |
| Standard Deviation (Sample) | 0.49% | 1.2% |
| Standard Deviation (Population) | 0.49% | 1.2% |
Similar Demographics by Vision Disability
Demographics Similar to Immigrants from India by Vision Disability
In terms of vision disability, the demographic groups most similar to Immigrants from India are Filipino (1.7%, a difference of 0.050%), Immigrants from Taiwan (1.7%, a difference of 0.71%), Thai (1.7%, a difference of 3.4%), Okinawan (1.8%, a difference of 5.3%), and Immigrants from Iran (1.8%, a difference of 6.0%).
| Demographics | Rating | Rank | Vision Disability |
| Immigrants | India | 100.0 /100 | #1 | Exceptional 1.7% |
| Filipinos | 100.0 /100 | #2 | Exceptional 1.7% |
| Immigrants | Taiwan | 100.0 /100 | #3 | Exceptional 1.7% |
| Thais | 100.0 /100 | #4 | Exceptional 1.7% |
| Okinawans | 100.0 /100 | #5 | Exceptional 1.8% |
| Immigrants | Iran | 100.0 /100 | #6 | Exceptional 1.8% |
| Immigrants | South Central Asia | 100.0 /100 | #7 | Exceptional 1.8% |
| Iranians | 100.0 /100 | #8 | Exceptional 1.8% |
| Immigrants | Singapore | 100.0 /100 | #9 | Exceptional 1.8% |
| Immigrants | Hong Kong | 100.0 /100 | #10 | Exceptional 1.8% |
| Immigrants | Israel | 100.0 /100 | #11 | Exceptional 1.8% |
| Immigrants | Korea | 100.0 /100 | #12 | Exceptional 1.8% |
| Immigrants | Eastern Asia | 100.0 /100 | #13 | Exceptional 1.8% |
| Immigrants | China | 100.0 /100 | #14 | Exceptional 1.8% |
| Immigrants | Bolivia | 100.0 /100 | #15 | Exceptional 1.8% |
Demographics Similar to Immigrants from Portugal by Vision Disability
In terms of vision disability, the demographic groups most similar to Immigrants from Portugal are Immigrants from Congo (2.3%, a difference of 0.050%), Marshallese (2.3%, a difference of 0.14%), Scottish (2.3%, a difference of 0.21%), Immigrants from Cambodia (2.3%, a difference of 0.27%), and English (2.3%, a difference of 0.29%).
| Demographics | Rating | Rank | Vision Disability |
| Nicaraguans | 2.2 /100 | #230 | Tragic 2.3% |
| Immigrants | Ecuador | 2.0 /100 | #231 | Tragic 2.3% |
| German Russians | 1.8 /100 | #232 | Tragic 2.3% |
| Central Americans | 1.8 /100 | #233 | Tragic 2.3% |
| Scottish | 1.6 /100 | #234 | Tragic 2.3% |
| Marshallese | 1.5 /100 | #235 | Tragic 2.3% |
| Immigrants | Congo | 1.4 /100 | #236 | Tragic 2.3% |
| Immigrants | Portugal | 1.4 /100 | #237 | Tragic 2.3% |
| Immigrants | Cambodia | 1.1 /100 | #238 | Tragic 2.3% |
| English | 1.1 /100 | #239 | Tragic 2.3% |
| Panamanians | 0.9 /100 | #240 | Tragic 2.3% |
| Malaysians | 0.9 /100 | #241 | Tragic 2.3% |
| Immigrants | Panama | 0.8 /100 | #242 | Tragic 2.3% |
| Immigrants | Nicaragua | 0.6 /100 | #243 | Tragic 2.3% |
| Immigrants | West Indies | 0.6 /100 | #244 | Tragic 2.3% |