Immigrants from Hungary vs Salvadoran Disability Age 35 to 64
COMPARE
Immigrants from Hungary
Salvadoran
Disability Age 35 to 64
Disability Age 35 to 64 Comparison
Immigrants from Hungary
Salvadorans
10.4%
DISABILITY AGE 35 TO 64
97.6/ 100
METRIC RATING
106th/ 347
METRIC RANK
10.7%
DISABILITY AGE 35 TO 64
91.9/ 100
METRIC RATING
136th/ 347
METRIC RANK
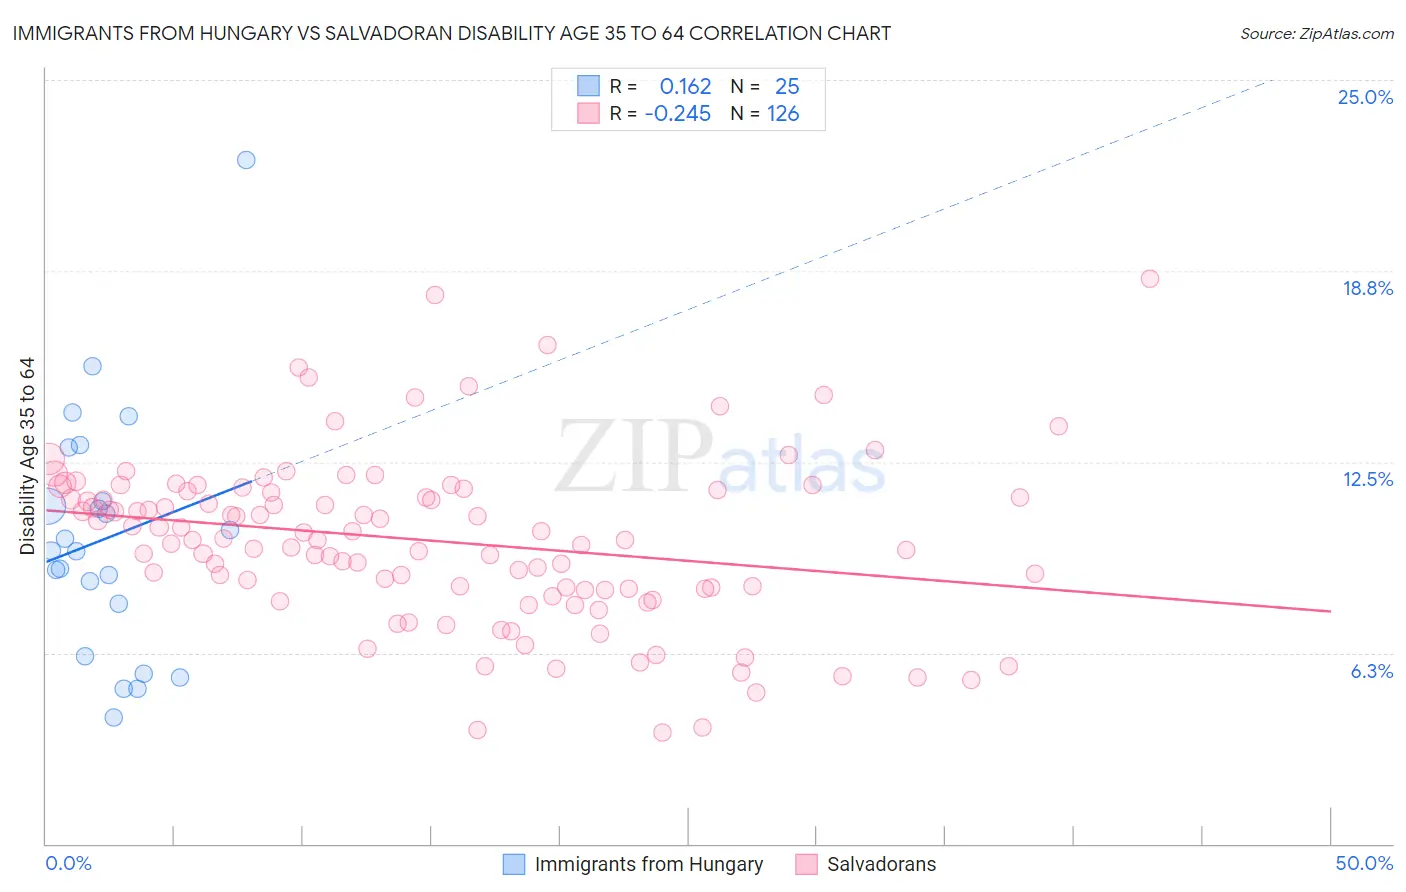
Immigrants from Hungary vs Salvadoran Disability Age 35 to 64 Correlation Chart
The statistical analysis conducted on geographies consisting of 195,643,662 people shows a poor positive correlation between the proportion of Immigrants from Hungary and percentage of population with a disability between the ages 34 and 64 in the United States with a correlation coefficient (R) of 0.162 and weighted average of 10.4%. Similarly, the statistical analysis conducted on geographies consisting of 398,635,683 people shows a weak negative correlation between the proportion of Salvadorans and percentage of population with a disability between the ages 34 and 64 in the United States with a correlation coefficient (R) of -0.245 and weighted average of 10.7%, a difference of 2.8%.
Disability Age 35 to 64 Correlation Summary
| Measurement | Immigrants from Hungary | Salvadoran |
| Minimum | 4.1% | 3.7% |
| Maximum | 22.4% | 18.5% |
| Range | 18.3% | 14.8% |
| Mean | 10.0% | 9.9% |
| Median | 9.6% | 10.0% |
| Interquartile 25% (IQ1) | 7.0% | 8.3% |
| Interquartile 75% (IQ3) | 12.1% | 11.5% |
| Interquartile Range (IQR) | 5.1% | 3.2% |
| Standard Deviation (Sample) | 4.0% | 2.7% |
| Standard Deviation (Population) | 3.9% | 2.7% |
Similar Demographics by Disability Age 35 to 64
Demographics Similar to Immigrants from Hungary by Disability Age 35 to 64
In terms of disability age 35 to 64, the demographic groups most similar to Immigrants from Hungary are Macedonian (10.4%, a difference of 0.15%), Immigrants from Austria (10.4%, a difference of 0.17%), Zimbabwean (10.4%, a difference of 0.19%), Ethiopian (10.5%, a difference of 0.21%), and Immigrants from Ukraine (10.4%, a difference of 0.31%).
| Demographics | Rating | Rank | Disability Age 35 to 64 |
| Palestinians | 98.2 /100 | #99 | Exceptional 10.4% |
| Immigrants | Jordan | 98.1 /100 | #100 | Exceptional 10.4% |
| Immigrants | Philippines | 98.0 /100 | #101 | Exceptional 10.4% |
| Immigrants | Western Asia | 98.0 /100 | #102 | Exceptional 10.4% |
| Immigrants | Ukraine | 97.9 /100 | #103 | Exceptional 10.4% |
| Immigrants | Austria | 97.8 /100 | #104 | Exceptional 10.4% |
| Macedonians | 97.8 /100 | #105 | Exceptional 10.4% |
| Immigrants | Hungary | 97.6 /100 | #106 | Exceptional 10.4% |
| Zimbabweans | 97.4 /100 | #107 | Exceptional 10.4% |
| Ethiopians | 97.4 /100 | #108 | Exceptional 10.5% |
| Immigrants | Ethiopia | 97.2 /100 | #109 | Exceptional 10.5% |
| Koreans | 97.1 /100 | #110 | Exceptional 10.5% |
| Brazilians | 96.9 /100 | #111 | Exceptional 10.5% |
| Assyrians/Chaldeans/Syriacs | 96.8 /100 | #112 | Exceptional 10.5% |
| Tongans | 96.6 /100 | #113 | Exceptional 10.5% |
Demographics Similar to Salvadorans by Disability Age 35 to 64
In terms of disability age 35 to 64, the demographic groups most similar to Salvadorans are Immigrants from Costa Rica (10.7%, a difference of 0.070%), Greek (10.7%, a difference of 0.11%), Immigrants from Southern Europe (10.7%, a difference of 0.12%), Costa Rican (10.7%, a difference of 0.13%), and Immigrants (10.7%, a difference of 0.16%).
| Demographics | Rating | Rank | Disability Age 35 to 64 |
| Ecuadorians | 93.1 /100 | #129 | Exceptional 10.7% |
| Immigrants | Syria | 93.0 /100 | #130 | Exceptional 10.7% |
| Immigrants | El Salvador | 92.8 /100 | #131 | Exceptional 10.7% |
| Immigrants | Albania | 92.5 /100 | #132 | Exceptional 10.7% |
| Immigrants | Immigrants | 92.5 /100 | #133 | Exceptional 10.7% |
| Immigrants | Ecuador | 92.5 /100 | #134 | Exceptional 10.7% |
| Greeks | 92.3 /100 | #135 | Exceptional 10.7% |
| Salvadorans | 91.9 /100 | #136 | Exceptional 10.7% |
| Immigrants | Costa Rica | 91.7 /100 | #137 | Exceptional 10.7% |
| Immigrants | Southern Europe | 91.5 /100 | #138 | Exceptional 10.7% |
| Costa Ricans | 91.4 /100 | #139 | Exceptional 10.7% |
| Immigrants | Scotland | 91.3 /100 | #140 | Exceptional 10.7% |
| Australians | 90.7 /100 | #141 | Exceptional 10.8% |
| Immigrants | Saudi Arabia | 90.6 /100 | #142 | Exceptional 10.8% |
| Sierra Leoneans | 89.7 /100 | #143 | Excellent 10.8% |