Immigrants from Hungary vs Immigrants from Northern Africa Hearing Disability
COMPARE
Immigrants from Hungary
Immigrants from Northern Africa
Hearing Disability
Hearing Disability Comparison
Immigrants from Hungary
Immigrants from Northern Africa
3.1%
HEARING DISABILITY
12.5/ 100
METRIC RATING
209th/ 347
METRIC RANK
2.8%
HEARING DISABILITY
96.9/ 100
METRIC RATING
85th/ 347
METRIC RANK
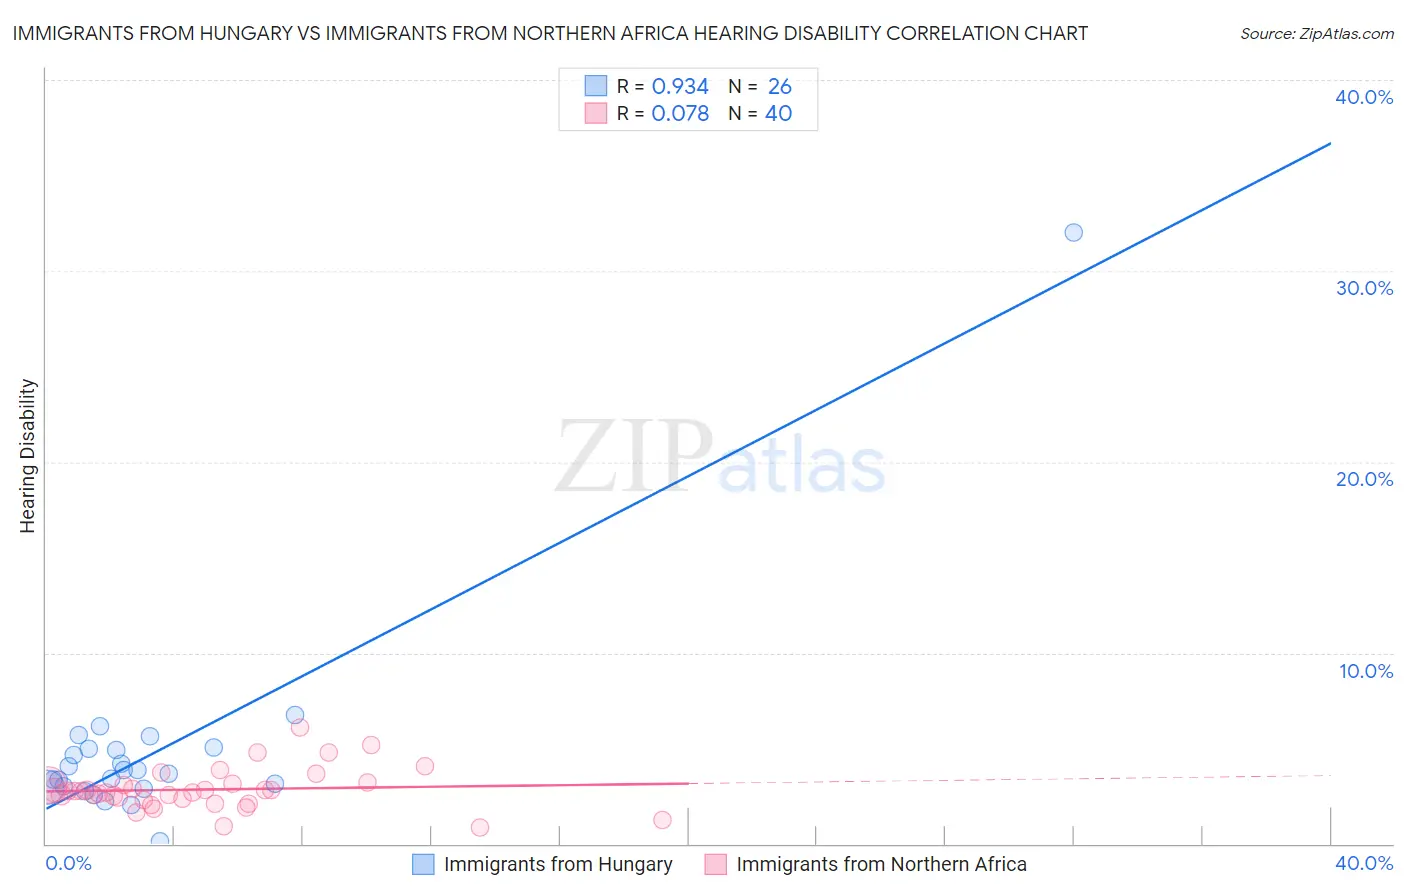
Immigrants from Hungary vs Immigrants from Northern Africa Hearing Disability Correlation Chart
The statistical analysis conducted on geographies consisting of 195,680,611 people shows a near-perfect positive correlation between the proportion of Immigrants from Hungary and percentage of population with hearing disability in the United States with a correlation coefficient (R) of 0.934 and weighted average of 3.1%. Similarly, the statistical analysis conducted on geographies consisting of 321,108,850 people shows a slight positive correlation between the proportion of Immigrants from Northern Africa and percentage of population with hearing disability in the United States with a correlation coefficient (R) of 0.078 and weighted average of 2.8%, a difference of 13.7%.
Hearing Disability Correlation Summary
| Measurement | Immigrants from Hungary | Immigrants from Northern Africa |
| Minimum | 0.15% | 0.86% |
| Maximum | 32.0% | 6.1% |
| Range | 31.9% | 5.3% |
| Mean | 4.9% | 2.8% |
| Median | 3.8% | 2.8% |
| Interquartile 25% (IQ1) | 2.9% | 2.3% |
| Interquartile 75% (IQ3) | 5.0% | 3.1% |
| Interquartile Range (IQR) | 2.0% | 0.81% |
| Standard Deviation (Sample) | 5.7% | 1.1% |
| Standard Deviation (Population) | 5.6% | 1.1% |
Similar Demographics by Hearing Disability
Demographics Similar to Immigrants from Hungary by Hearing Disability
In terms of hearing disability, the demographic groups most similar to Immigrants from Hungary are Immigrants from Latvia (3.1%, a difference of 0.040%), Cape Verdean (3.1%, a difference of 0.050%), Romanian (3.1%, a difference of 0.080%), Pakistani (3.1%, a difference of 0.29%), and Immigrants from Iraq (3.1%, a difference of 0.44%).
| Demographics | Rating | Rank | Hearing Disability |
| Immigrants | Thailand | 16.4 /100 | #202 | Poor 3.1% |
| Immigrants | Denmark | 16.2 /100 | #203 | Poor 3.1% |
| Immigrants | Czechoslovakia | 15.9 /100 | #204 | Poor 3.1% |
| Alsatians | 15.9 /100 | #205 | Poor 3.1% |
| Eastern Europeans | 15.5 /100 | #206 | Poor 3.1% |
| Hispanics or Latinos | 15.1 /100 | #207 | Poor 3.1% |
| Immigrants | Latvia | 12.7 /100 | #208 | Poor 3.1% |
| Immigrants | Hungary | 12.5 /100 | #209 | Poor 3.1% |
| Cape Verdeans | 12.2 /100 | #210 | Poor 3.1% |
| Romanians | 12.1 /100 | #211 | Poor 3.1% |
| Pakistanis | 11.1 /100 | #212 | Poor 3.1% |
| Immigrants | Iraq | 10.5 /100 | #213 | Poor 3.1% |
| Australians | 8.1 /100 | #214 | Tragic 3.2% |
| Bangladeshis | 8.1 /100 | #215 | Tragic 3.2% |
| Immigrants | Norway | 7.3 /100 | #216 | Tragic 3.2% |
Demographics Similar to Immigrants from Northern Africa by Hearing Disability
In terms of hearing disability, the demographic groups most similar to Immigrants from Northern Africa are Immigrants from Iran (2.8%, a difference of 0.020%), Immigrants from Argentina (2.8%, a difference of 0.070%), Somali (2.8%, a difference of 0.13%), Immigrants from Turkey (2.8%, a difference of 0.17%), and Belizean (2.8%, a difference of 0.20%).
| Demographics | Rating | Rank | Hearing Disability |
| Mongolians | 97.4 /100 | #78 | Exceptional 2.7% |
| Colombians | 97.4 /100 | #79 | Exceptional 2.7% |
| Immigrants | Asia | 97.2 /100 | #80 | Exceptional 2.7% |
| Immigrants | Uruguay | 97.2 /100 | #81 | Exceptional 2.7% |
| Immigrants | Armenia | 97.2 /100 | #82 | Exceptional 2.7% |
| Immigrants | Cuba | 97.2 /100 | #83 | Exceptional 2.7% |
| Immigrants | Argentina | 97.0 /100 | #84 | Exceptional 2.8% |
| Immigrants | Northern Africa | 96.9 /100 | #85 | Exceptional 2.8% |
| Immigrants | Iran | 96.8 /100 | #86 | Exceptional 2.8% |
| Somalis | 96.7 /100 | #87 | Exceptional 2.8% |
| Immigrants | Turkey | 96.7 /100 | #88 | Exceptional 2.8% |
| Belizeans | 96.6 /100 | #89 | Exceptional 2.8% |
| Immigrants | Morocco | 96.6 /100 | #90 | Exceptional 2.8% |
| Immigrants | Middle Africa | 96.5 /100 | #91 | Exceptional 2.8% |
| Iranians | 96.4 /100 | #92 | Exceptional 2.8% |