Immigrants from Hong Kong vs Seminole Disability Age 65 to 74
COMPARE
Immigrants from Hong Kong
Seminole
Disability Age 65 to 74
Disability Age 65 to 74 Comparison
Immigrants from Hong Kong
Seminole
19.9%
DISABILITY AGE 65 TO 74
100.0/ 100
METRIC RATING
4th/ 347
METRIC RANK
29.4%
DISABILITY AGE 65 TO 74
0.0/ 100
METRIC RATING
324th/ 347
METRIC RANK
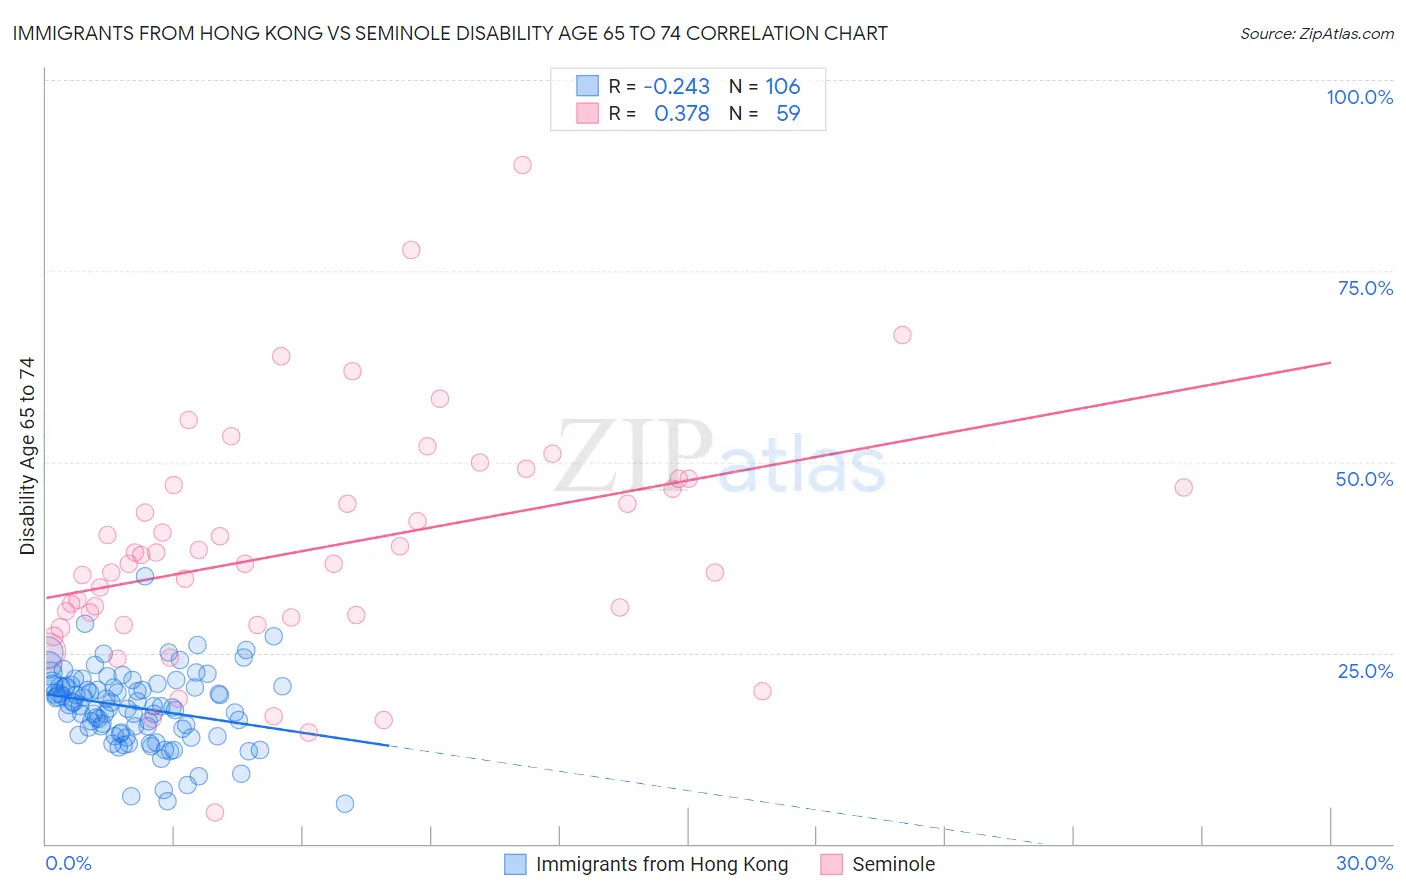
Immigrants from Hong Kong vs Seminole Disability Age 65 to 74 Correlation Chart
The statistical analysis conducted on geographies consisting of 253,698,162 people shows a weak negative correlation between the proportion of Immigrants from Hong Kong and percentage of population with a disability between the ages 65 and 75 in the United States with a correlation coefficient (R) of -0.243 and weighted average of 19.9%. Similarly, the statistical analysis conducted on geographies consisting of 118,257,579 people shows a mild positive correlation between the proportion of Seminole and percentage of population with a disability between the ages 65 and 75 in the United States with a correlation coefficient (R) of 0.378 and weighted average of 29.4%, a difference of 48.2%.
Disability Age 65 to 74 Correlation Summary
| Measurement | Immigrants from Hong Kong | Seminole |
| Minimum | 5.3% | 4.1% |
| Maximum | 35.1% | 88.9% |
| Range | 29.8% | 84.8% |
| Mean | 17.8% | 38.6% |
| Median | 18.2% | 36.7% |
| Interquartile 25% (IQ1) | 14.6% | 29.6% |
| Interquartile 75% (IQ3) | 20.6% | 46.9% |
| Interquartile Range (IQR) | 6.0% | 17.3% |
| Standard Deviation (Sample) | 5.0% | 15.3% |
| Standard Deviation (Population) | 4.9% | 15.2% |
Similar Demographics by Disability Age 65 to 74
Demographics Similar to Immigrants from Hong Kong by Disability Age 65 to 74
In terms of disability age 65 to 74, the demographic groups most similar to Immigrants from Hong Kong are Immigrants from Israel (19.9%, a difference of 0.30%), Iranian (19.9%, a difference of 0.41%), Immigrants from India (19.7%, a difference of 0.84%), Cypriot (20.1%, a difference of 1.1%), and Thai (20.1%, a difference of 1.1%).
| Demographics | Rating | Rank | Disability Age 65 to 74 |
| Immigrants | Taiwan | 100.0 /100 | #1 | Exceptional 18.8% |
| Filipinos | 100.0 /100 | #2 | Exceptional 19.0% |
| Immigrants | India | 100.0 /100 | #3 | Exceptional 19.7% |
| Immigrants | Hong Kong | 100.0 /100 | #4 | Exceptional 19.9% |
| Immigrants | Israel | 100.0 /100 | #5 | Exceptional 19.9% |
| Iranians | 100.0 /100 | #6 | Exceptional 19.9% |
| Cypriots | 100.0 /100 | #7 | Exceptional 20.1% |
| Thais | 100.0 /100 | #8 | Exceptional 20.1% |
| Immigrants | China | 100.0 /100 | #9 | Exceptional 20.3% |
| Immigrants | Eastern Asia | 100.0 /100 | #10 | Exceptional 20.3% |
| Immigrants | Ireland | 100.0 /100 | #11 | Exceptional 20.3% |
| Immigrants | Korea | 100.0 /100 | #12 | Exceptional 20.4% |
| Immigrants | Singapore | 100.0 /100 | #13 | Exceptional 20.4% |
| Indians (Asian) | 100.0 /100 | #14 | Exceptional 20.5% |
| Paraguayans | 100.0 /100 | #15 | Exceptional 20.5% |
Demographics Similar to Seminole by Disability Age 65 to 74
In terms of disability age 65 to 74, the demographic groups most similar to Seminole are Dutch West Indian (29.6%, a difference of 0.45%), Yakama (29.6%, a difference of 0.68%), Apache (29.7%, a difference of 0.83%), Puerto Rican (29.1%, a difference of 0.97%), and Hopi (30.0%, a difference of 1.8%).
| Demographics | Rating | Rank | Disability Age 65 to 74 |
| Immigrants | Armenia | 0.0 /100 | #317 | Tragic 28.0% |
| Nepalese | 0.0 /100 | #318 | Tragic 28.0% |
| Arapaho | 0.0 /100 | #319 | Tragic 28.1% |
| Cherokee | 0.0 /100 | #320 | Tragic 28.2% |
| Comanche | 0.0 /100 | #321 | Tragic 28.3% |
| Aleuts | 0.0 /100 | #322 | Tragic 28.4% |
| Puerto Ricans | 0.0 /100 | #323 | Tragic 29.1% |
| Seminole | 0.0 /100 | #324 | Tragic 29.4% |
| Dutch West Indians | 0.0 /100 | #325 | Tragic 29.6% |
| Yakama | 0.0 /100 | #326 | Tragic 29.6% |
| Apache | 0.0 /100 | #327 | Tragic 29.7% |
| Hopi | 0.0 /100 | #328 | Tragic 30.0% |
| Choctaw | 0.0 /100 | #329 | Tragic 30.2% |
| Creek | 0.0 /100 | #330 | Tragic 30.2% |
| Chickasaw | 0.0 /100 | #331 | Tragic 30.2% |