Immigrants from Hong Kong vs Navajo Hearing Disability
COMPARE
Immigrants from Hong Kong
Navajo
Hearing Disability
Hearing Disability Comparison
Immigrants from Hong Kong
Navajo
2.7%
HEARING DISABILITY
99.2/ 100
METRIC RATING
51st/ 347
METRIC RANK
4.6%
HEARING DISABILITY
0.0/ 100
METRIC RATING
341st/ 347
METRIC RANK
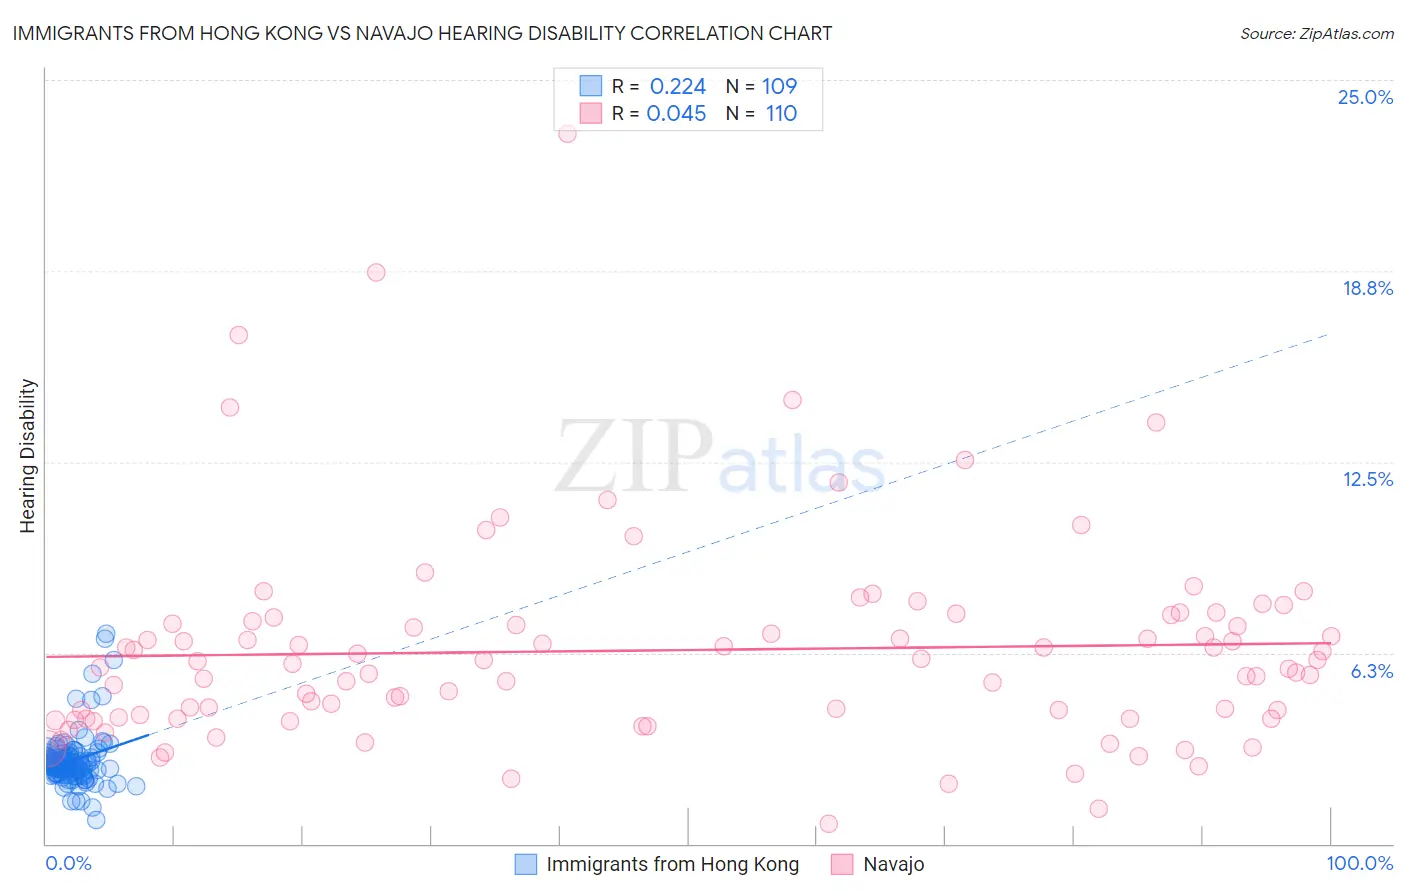
Immigrants from Hong Kong vs Navajo Hearing Disability Correlation Chart
The statistical analysis conducted on geographies consisting of 253,945,747 people shows a weak positive correlation between the proportion of Immigrants from Hong Kong and percentage of population with hearing disability in the United States with a correlation coefficient (R) of 0.224 and weighted average of 2.7%. Similarly, the statistical analysis conducted on geographies consisting of 224,724,902 people shows no correlation between the proportion of Navajo and percentage of population with hearing disability in the United States with a correlation coefficient (R) of 0.045 and weighted average of 4.6%, a difference of 74.2%.
Hearing Disability Correlation Summary
| Measurement | Immigrants from Hong Kong | Navajo |
| Minimum | 0.77% | 0.66% |
| Maximum | 6.9% | 23.2% |
| Range | 6.1% | 22.6% |
| Mean | 2.7% | 6.3% |
| Median | 2.6% | 5.8% |
| Interquartile 25% (IQ1) | 2.3% | 4.1% |
| Interquartile 75% (IQ3) | 2.9% | 7.3% |
| Interquartile Range (IQR) | 0.63% | 3.2% |
| Standard Deviation (Sample) | 0.93% | 3.4% |
| Standard Deviation (Population) | 0.92% | 3.4% |
Similar Demographics by Hearing Disability
Demographics Similar to Immigrants from Hong Kong by Hearing Disability
In terms of hearing disability, the demographic groups most similar to Immigrants from Hong Kong are Paraguayan (2.7%, a difference of 0.070%), Immigrants from South America (2.7%, a difference of 0.26%), Jamaican (2.7%, a difference of 0.36%), Immigrants from Singapore (2.6%, a difference of 0.38%), and Immigrants from Eastern Asia (2.7%, a difference of 0.42%).
| Demographics | Rating | Rank | Hearing Disability |
| Nigerians | 99.4 /100 | #44 | Exceptional 2.6% |
| Venezuelans | 99.4 /100 | #45 | Exceptional 2.6% |
| Immigrants | Dominica | 99.3 /100 | #46 | Exceptional 2.6% |
| Immigrants | Israel | 99.3 /100 | #47 | Exceptional 2.6% |
| Immigrants | Singapore | 99.3 /100 | #48 | Exceptional 2.6% |
| Immigrants | South America | 99.2 /100 | #49 | Exceptional 2.7% |
| Paraguayans | 99.2 /100 | #50 | Exceptional 2.7% |
| Immigrants | Hong Kong | 99.2 /100 | #51 | Exceptional 2.7% |
| Jamaicans | 99.0 /100 | #52 | Exceptional 2.7% |
| Immigrants | Eastern Asia | 99.0 /100 | #53 | Exceptional 2.7% |
| Ethiopians | 99.0 /100 | #54 | Exceptional 2.7% |
| Immigrants | Ethiopia | 99.0 /100 | #55 | Exceptional 2.7% |
| Immigrants | Nicaragua | 99.0 /100 | #56 | Exceptional 2.7% |
| South Americans | 99.0 /100 | #57 | Exceptional 2.7% |
| Immigrants | Peru | 98.6 /100 | #58 | Exceptional 2.7% |
Demographics Similar to Navajo by Hearing Disability
In terms of hearing disability, the demographic groups most similar to Navajo are Pueblo (4.6%, a difference of 0.33%), Tsimshian (4.7%, a difference of 1.5%), Inupiat (4.7%, a difference of 1.8%), Choctaw (4.5%, a difference of 1.8%), and Alaska Native (4.5%, a difference of 3.3%).
| Demographics | Rating | Rank | Hearing Disability |
| Dutch West Indians | 0.0 /100 | #333 | Tragic 4.3% |
| Aleuts | 0.0 /100 | #334 | Tragic 4.3% |
| Kiowa | 0.0 /100 | #335 | Tragic 4.3% |
| Creek | 0.0 /100 | #336 | Tragic 4.4% |
| Chickasaw | 0.0 /100 | #337 | Tragic 4.5% |
| Alaska Natives | 0.0 /100 | #338 | Tragic 4.5% |
| Choctaw | 0.0 /100 | #339 | Tragic 4.5% |
| Pueblo | 0.0 /100 | #340 | Tragic 4.6% |
| Navajo | 0.0 /100 | #341 | Tragic 4.6% |
| Tsimshian | 0.0 /100 | #342 | Tragic 4.7% |
| Inupiat | 0.0 /100 | #343 | Tragic 4.7% |
| Tlingit-Haida | 0.0 /100 | #344 | Tragic 4.8% |
| Alaskan Athabascans | 0.0 /100 | #345 | Tragic 5.3% |
| Colville | 0.0 /100 | #346 | Tragic 5.3% |
| Yup'ik | 0.0 /100 | #347 | Tragic 5.8% |