Immigrants from Honduras vs Ugandan Disability Age 65 to 74

COMPARE

Immigrants from Honduras
Race
Ancestry
AfghanAfricanAlaska NativeAlaskan AthabascanAlbanianAleutAlsatianAmericanApacheArabArapahoArgentineanArmenianAssyrian/Chaldean/SyriacAustralianAustrianBahamianBangladeshiBarbadianBasqueBelgianBelizeanBermudanBhutaneseBlackfeetBolivianBrazilianBritishBritish West IndianBulgarianBurmeseCajunCambodianCanadianCape VerdeanCarpatho RusynCelticCentral AmericanCentral American IndianCherokeeCheyenneChickasawChileanChineseChippewaChoctawColombianColvilleComancheCosta RicanCreeCreekCroatianCrowCubanCypriotCzechCzechoslovakianDanishDelawareDominicanDutchDutch West IndianEastern EuropeanEcuadorianEgyptianEnglishEstonianEthiopianEuropeanFijianFilipinoFinnishFrenchFrench American IndianFrench CanadianGermanGerman RussianGhanaianGreekGuamanian/ChamorroGuatemalanGuyaneseHaitianHmongHonduranHopiHoumaHungarianIcelanderIndian (Asian)IndonesianInupiatIranianIraqiIrishIroquoisIsraeliItalianJamaicanJapaneseJordanianKenyanKiowaKoreanLaotianLatvianLebaneseLiberianLithuanianLumbeeLuxembourgerMacedonianMalaysianMalteseMarshalleseMenomineeMexicanMexican American IndianMongolianMoroccanNative HawaiianNavajoNepaleseNew ZealanderNicaraguanNigerianNorthern EuropeanNorwegianOkinawanOsageOttawaPaiutePakistaniPalestinianPanamanianParaguayanPennsylvania GermanPeruvianPimaPolishPortuguesePotawatomiPuebloPuerto RicanPuget Sound SalishRomanianRussianSalvadoranSamoanScandinavianScotch-IrishScottishSeminoleSenegaleseSerbianShoshoneSierra LeoneanSiouxSlavicSlovakSloveneSomaliSouth AfricanSouth AmericanSouth American IndianSoviet UnionSpaniardSpanishSpanish AmericanSpanish American IndianSri LankanSubsaharan AfricanSudaneseSwedishSwissSyrianTaiwaneseThaiTlingit-HaidaTohono O'OdhamTonganTrinidadian and TobagonianTsimshianTurkishU.S. Virgin IslanderUkrainianUruguayanUteVenezuelanVietnameseWelshWest IndianYakamaYaquiYugoslavianYumanYup'ikZimbabwean
Immigration
NonimmigrantsImmigrantsAfghanistanAfricaAlbaniaArgentinaArmeniaAsiaAustraliaAustriaBahamasBangladeshBarbadosBelarusBelgiumBelizeBoliviaBosnia and HerzegovinaBrazilBulgariaBurma/MyanmarCabo VerdeCambodiaCameroonCanadaCaribbeanCentral AmericaChileChinaColombiaCongoCosta RicaCroatiaCubaCzechoslovakiaDenmarkDominicaDominican RepublicEastern AfricaEastern AsiaEastern EuropeEcuadorEgyptEl SalvadorEnglandEritreaEthiopiaEuropeFijiFranceGermanyGhanaGreeceGrenadaGuatemalaGuyanaHaitiHondurasHong KongHungaryIndiaIndonesiaIranIraqIrelandIsraelItalyJamaicaJapanJordanKazakhstanKenyaKoreaKuwaitLaosLatin AmericaLatviaLebanonLiberiaLithuaniaMalaysiaMexicoMicronesiaMiddle AfricaMoldovaMoroccoNepalNetherlandsNicaraguaNigeriaNorth AmericaNorth MacedoniaNorthern AfricaNorthern EuropeNorwayOceaniaPakistanPanamaPeruPhilippinesPolandPortugalRomaniaRussiaSaudi ArabiaScotlandSenegalSerbiaSierra LeoneSingaporeSomaliaSouth AfricaSouth AmericaSouth Central AsiaSouth Eastern AsiaSouthern EuropeSpainSri LankaSt. Vincent and the GrenadinesSudanSwedenSwitzerlandSyriaTaiwanThailandTrinidad and TobagoTurkeyUgandaUkraineUruguayUzbekistanVenezuelaVietnamWest IndiesWestern AfricaWestern AsiaWestern EuropeYemenZaireZimbabweAzores
Ugandan
Race
Ancestry
AfghanAfricanAlaska NativeAlaskan AthabascanAlbanianAleutAlsatianAmericanApacheArabArapahoArgentineanArmenianAssyrian/Chaldean/SyriacAustralianAustrianBahamianBangladeshiBarbadianBasqueBelgianBelizeanBermudanBhutaneseBlackfeetBolivianBrazilianBritishBritish West IndianBulgarianBurmeseCajunCambodianCanadianCape VerdeanCarpatho RusynCelticCentral AmericanCentral American IndianCherokeeCheyenneChickasawChileanChineseChippewaChoctawColombianColvilleComancheCosta RicanCreeCreekCroatianCrowCubanCypriotCzechCzechoslovakianDanishDelawareDominicanDutchDutch West IndianEastern EuropeanEcuadorianEgyptianEnglishEstonianEthiopianEuropeanFijianFilipinoFinnishFrenchFrench American IndianFrench CanadianGermanGerman RussianGhanaianGreekGuamanian/ChamorroGuatemalanGuyaneseHaitianHmongHonduranHopiHoumaHungarianIcelanderIndian (Asian)IndonesianInupiatIranianIraqiIrishIroquoisIsraeliItalianJamaicanJapaneseJordanianKenyanKiowaKoreanLaotianLatvianLebaneseLiberianLithuanianLumbeeLuxembourgerMacedonianMalaysianMalteseMarshalleseMenomineeMexicanMexican American IndianMongolianMoroccanNative HawaiianNavajoNepaleseNew ZealanderNicaraguanNigerianNorthern EuropeanNorwegianOkinawanOsageOttawaPaiutePakistaniPalestinianPanamanianParaguayanPennsylvania GermanPeruvianPimaPolishPortuguesePotawatomiPuebloPuerto RicanPuget Sound SalishRomanianRussianSalvadoranSamoanScandinavianScotch-IrishScottishSeminoleSenegaleseSerbianShoshoneSierra LeoneanSiouxSlavicSlovakSloveneSomaliSouth AfricanSouth AmericanSouth American IndianSoviet UnionSpaniardSpanishSpanish AmericanSpanish American IndianSri LankanSubsaharan AfricanSudaneseSwedishSwissSyrianTaiwaneseThaiTlingit-HaidaTohono O'OdhamTonganTrinidadian and TobagonianTsimshianTurkishU.S. Virgin IslanderUgandanUkrainianUruguayanUteVenezuelanVietnameseWelshWest IndianYakamaYaquiYugoslavianYumanYup'ikZimbabwean
Immigration
NonimmigrantsImmigrantsAfghanistanAfricaAlbaniaArgentinaArmeniaAsiaAustraliaAustriaBahamasBangladeshBarbadosBelarusBelgiumBelizeBoliviaBosnia and HerzegovinaBrazilBulgariaBurma/MyanmarCabo VerdeCambodiaCameroonCanadaCaribbeanCentral AmericaChileChinaColombiaCongoCosta RicaCroatiaCubaCzechoslovakiaDenmarkDominicaDominican RepublicEastern AfricaEastern AsiaEastern EuropeEcuadorEgyptEl SalvadorEnglandEritreaEthiopiaEuropeFijiFranceGermanyGhanaGreeceGrenadaGuatemalaGuyanaHaitiHong KongHungaryIndiaIndonesiaIranIraqIrelandIsraelItalyJamaicaJapanJordanKazakhstanKenyaKoreaKuwaitLaosLatin AmericaLatviaLebanonLiberiaLithuaniaMalaysiaMexicoMicronesiaMiddle AfricaMoldovaMoroccoNepalNetherlandsNicaraguaNigeriaNorth AmericaNorth MacedoniaNorthern AfricaNorthern EuropeNorwayOceaniaPakistanPanamaPeruPhilippinesPolandPortugalRomaniaRussiaSaudi ArabiaScotlandSenegalSerbiaSierra LeoneSingaporeSomaliaSouth AfricaSouth AmericaSouth Central AsiaSouth Eastern AsiaSouthern EuropeSpainSri LankaSt. Vincent and the GrenadinesSudanSwedenSwitzerlandSyriaTaiwanThailandTrinidad and TobagoTurkeyUgandaUkraineUruguayUzbekistanVenezuelaVietnamWest IndiesWestern AfricaWestern AsiaWestern EuropeYemenZaireZimbabweAzores
Disability Age 65 to 74
Income
Poverty
Unemployment
Labor Participation
Family Structure
Vehicle Availability
Education Level
Disability

Disability Age 65 to 74 Comparison

Immigrants from Honduras

Ugandans

Tragic
Excellent
25.9%
DISABILITY AGE 65 TO 74
0.1/ 100
METRIC RATING
281st/ 347
METRIC RANK
22.7%
DISABILITY AGE 65 TO 74
85.4/ 100
METRIC RATING
140th/ 347
METRIC RANK

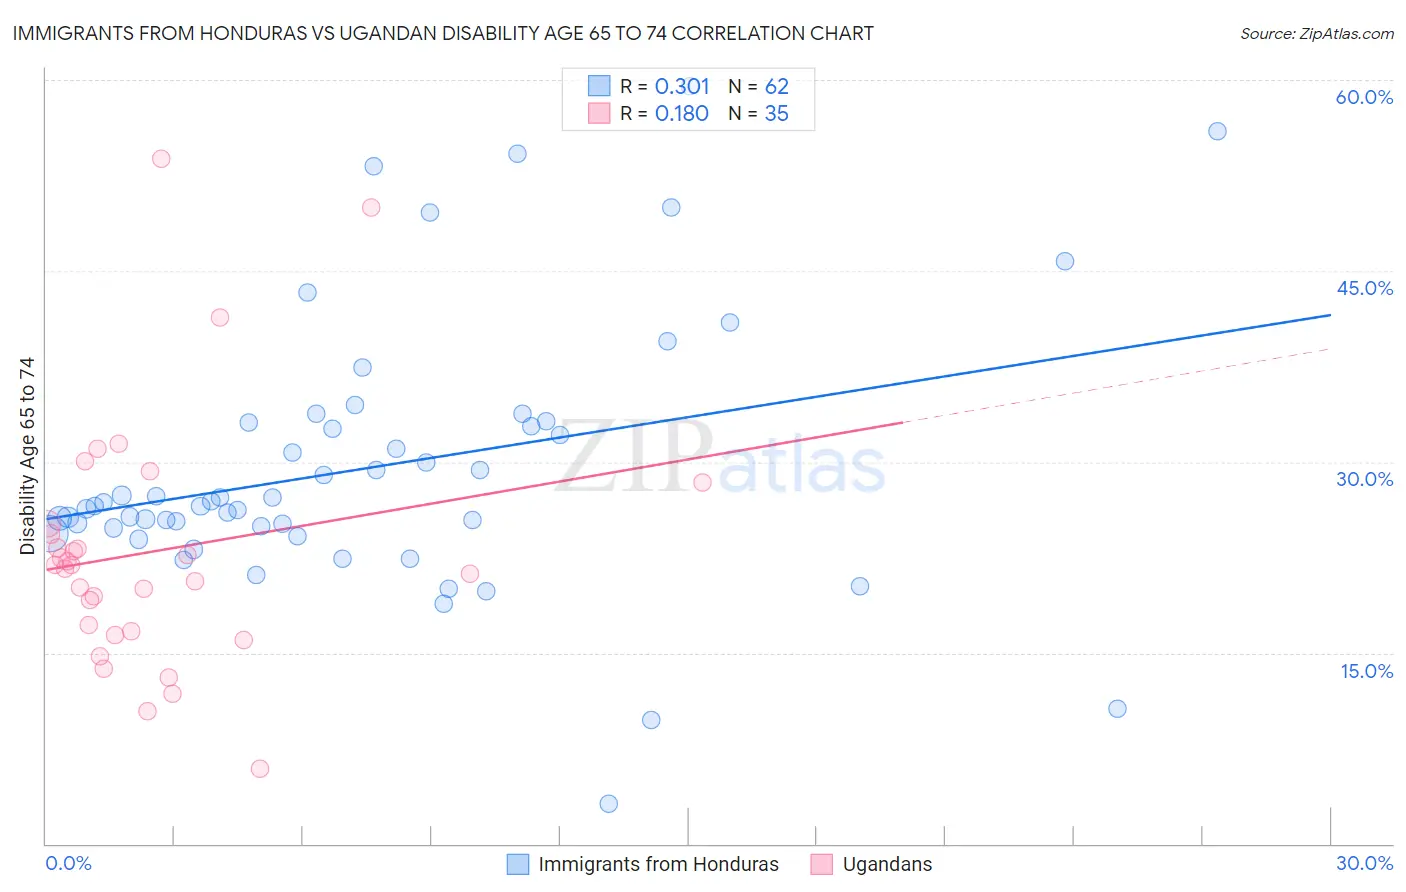
Immigrants from Honduras vs Ugandan Disability Age 65 to 74 Correlation Chart

The statistical analysis conducted on geographies consisting of 322,261,679 people shows a mild positive correlation between the proportion of Immigrants from Honduras and percentage of population with a disability between the ages 65 and 75 in the United States with a correlation coefficient (R) of 0.301 and weighted average of 25.9%. Similarly, the statistical analysis conducted on geographies consisting of 93,935,891 people shows a poor positive correlation between the proportion of Ugandans and percentage of population with a disability between the ages 65 and 75 in the United States with a correlation coefficient (R) of 0.180 and weighted average of 22.7%, a difference of 13.9%.
Immigrants from Honduras vs Ugandan Disability Age 65 to 74

Disability Age 65 to 74 Correlation Summary

MeasurementImmigrants from HondurasUgandan
Minimum3.1%5.9%
Maximum59.5%53.8%
Range56.4%48.0%
Mean29.6%23.0%
Median26.7%21.9%
Interquartile 25% (IQ1)24.8%16.7%
Interquartile 75% (IQ3)33.0%25.1%
Interquartile Range (IQR)8.2%8.4%
Standard Deviation (Sample)10.6%9.9%
Standard Deviation (Population)10.6%9.8%

Similar Demographics by Disability Age 65 to 74

Demographics Similar to Immigrants from Honduras by Disability Age 65 to 74

In terms of disability age 65 to 74, the demographic groups most similar to Immigrants from Honduras are Cree (25.9%, a difference of 0.020%), Delaware (25.9%, a difference of 0.070%), U.S. Virgin Islander (25.9%, a difference of 0.10%), Immigrants from Belize (25.8%, a difference of 0.19%), and Belizean (25.8%, a difference of 0.21%).
DemographicsRating | RankDisability Age 65 to 74
Americans
0.1
/100
|
#274
Tragic
25.8%
Hondurans
0.1
/100
|
#275
Tragic
25.8%
French American Indians
0.1
/100
|
#276
Tragic
25.8%
Belizeans
0.1
/100
|
#277
Tragic
25.8%
Immigrants | Belize
0.1
/100
|
#278
Tragic
25.8%
U.S. Virgin Islanders
0.1
/100
|
#279
Tragic
25.9%
Cree
0.1
/100
|
#280
Tragic
25.9%
Immigrants | Honduras
0.1
/100
|
#281
Tragic
25.9%
Delaware
0.1
/100
|
#282
Tragic
25.9%
Spanish Americans
0.0
/100
|
#283
Tragic
25.9%
Immigrants | Azores
0.0
/100
|
#284
Tragic
26.0%
Immigrants | Congo
0.0
/100
|
#285
Tragic
26.0%
Immigrants | Micronesia
0.0
/100
|
#286
Tragic
26.1%
Immigrants | Laos
0.0
/100
|
#287
Tragic
26.1%
Mexican American Indians
0.0
/100
|
#288
Tragic
26.2%

Demographics Similar to Ugandans by Disability Age 65 to 74

In terms of disability age 65 to 74, the demographic groups most similar to Ugandans are Belgian (22.7%, a difference of 0.010%), Immigrants from Ethiopia (22.7%, a difference of 0.020%), Immigrants from Syria (22.7%, a difference of 0.040%), Arab (22.8%, a difference of 0.080%), and Danish (22.8%, a difference of 0.12%).
DemographicsRating | RankDisability Age 65 to 74
Northern Europeans
88.9
/100
|
#133
Excellent
22.6%
Afghans
88.6
/100
|
#134
Excellent
22.6%
Immigrants | Ukraine
88.4
/100
|
#135
Excellent
22.6%
Ethiopians
87.9
/100
|
#136
Excellent
22.7%
Taiwanese
87.6
/100
|
#137
Excellent
22.7%
Immigrants | Moldova
87.3
/100
|
#138
Excellent
22.7%
Immigrants | Syria
85.8
/100
|
#139
Excellent
22.7%
Ugandans
85.4
/100
|
#140
Excellent
22.7%
Belgians
85.3
/100
|
#141
Excellent
22.7%
Immigrants | Ethiopia
85.3
/100
|
#142
Excellent
22.7%
Arabs
84.8
/100
|
#143
Excellent
22.8%
Danes
84.4
/100
|
#144
Excellent
22.8%
Immigrants | Uganda
84.0
/100
|
#145
Excellent
22.8%
Alsatians
83.7
/100
|
#146
Excellent
22.8%
Immigrants | Uzbekistan
83.1
/100
|
#147
Excellent
22.8%