Immigrants from Haiti vs Cape Verdean Ambulatory Disability
COMPARE
Immigrants from Haiti
Cape Verdean
Ambulatory Disability
Ambulatory Disability Comparison
Immigrants from Haiti
Cape Verdeans
6.5%
AMBULATORY DISABILITY
1.6/ 100
METRIC RATING
241st/ 347
METRIC RANK
6.9%
AMBULATORY DISABILITY
0.0/ 100
METRIC RATING
294th/ 347
METRIC RANK
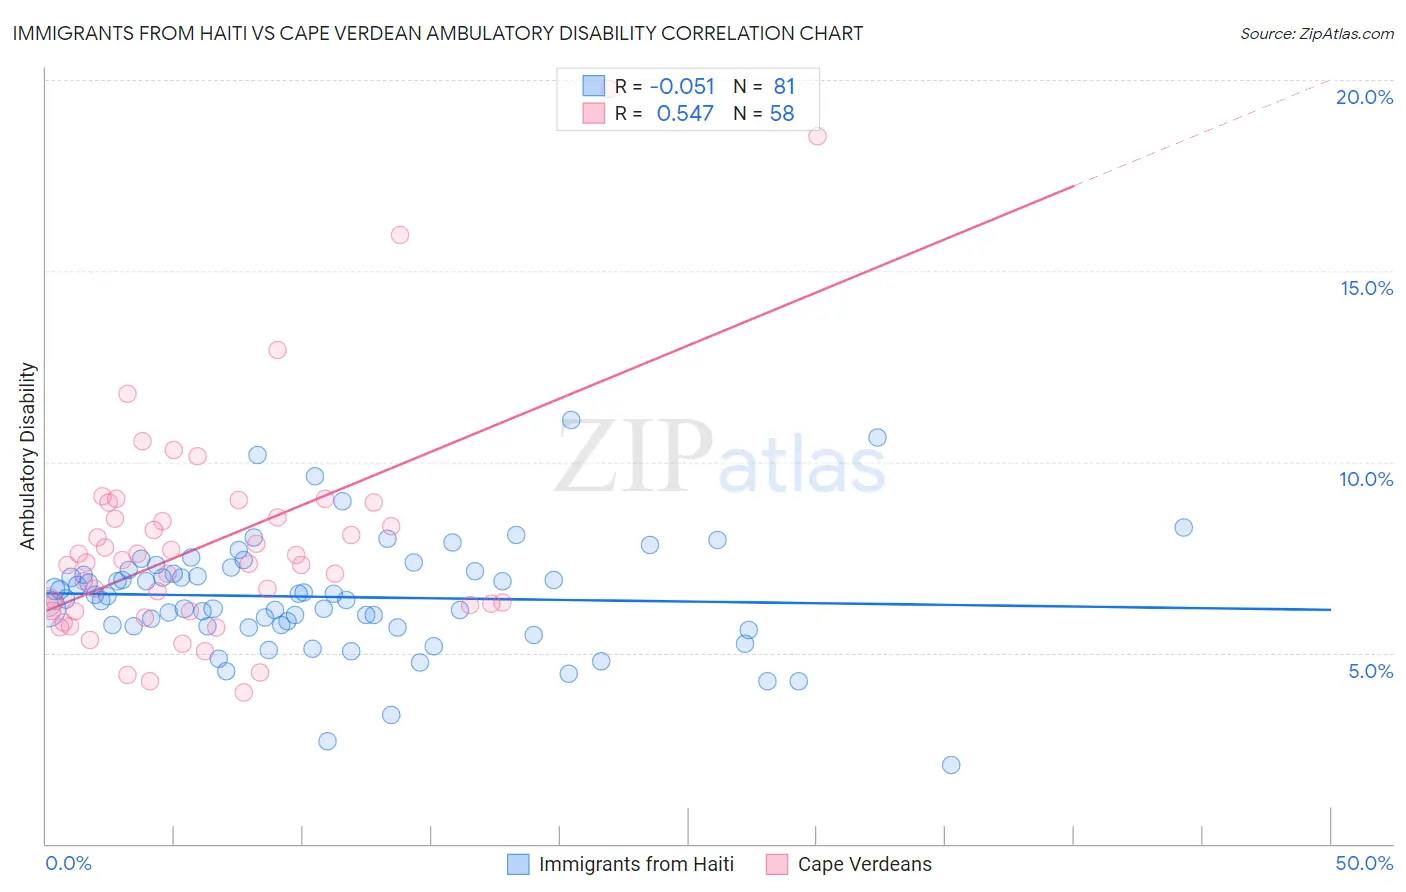
Immigrants from Haiti vs Cape Verdean Ambulatory Disability Correlation Chart
The statistical analysis conducted on geographies consisting of 225,209,570 people shows a slight negative correlation between the proportion of Immigrants from Haiti and percentage of population with ambulatory disability in the United States with a correlation coefficient (R) of -0.051 and weighted average of 6.5%. Similarly, the statistical analysis conducted on geographies consisting of 107,569,251 people shows a substantial positive correlation between the proportion of Cape Verdeans and percentage of population with ambulatory disability in the United States with a correlation coefficient (R) of 0.547 and weighted average of 6.9%, a difference of 7.0%.
Ambulatory Disability Correlation Summary
| Measurement | Immigrants from Haiti | Cape Verdean |
| Minimum | 2.1% | 4.0% |
| Maximum | 11.1% | 19.8% |
| Range | 9.0% | 15.8% |
| Mean | 6.5% | 7.9% |
| Median | 6.5% | 7.3% |
| Interquartile 25% (IQ1) | 5.7% | 6.1% |
| Interquartile 75% (IQ3) | 7.2% | 8.6% |
| Interquartile Range (IQR) | 1.5% | 2.5% |
| Standard Deviation (Sample) | 1.5% | 3.0% |
| Standard Deviation (Population) | 1.5% | 3.0% |
Similar Demographics by Ambulatory Disability
Demographics Similar to Immigrants from Haiti by Ambulatory Disability
In terms of ambulatory disability, the demographic groups most similar to Immigrants from Haiti are Spaniard (6.5%, a difference of 0.030%), German (6.5%, a difference of 0.050%), Immigrants from Panama (6.5%, a difference of 0.050%), Immigrants from Senegal (6.4%, a difference of 0.080%), and Tlingit-Haida (6.5%, a difference of 0.090%).
| Demographics | Rating | Rank | Ambulatory Disability |
| Immigrants | Liberia | 2.3 /100 | #234 | Tragic 6.4% |
| Hispanics or Latinos | 2.2 /100 | #235 | Tragic 6.4% |
| Dutch | 2.0 /100 | #236 | Tragic 6.4% |
| Immigrants | Germany | 1.8 /100 | #237 | Tragic 6.4% |
| Haitians | 1.8 /100 | #238 | Tragic 6.4% |
| Senegalese | 1.7 /100 | #239 | Tragic 6.4% |
| Immigrants | Senegal | 1.7 /100 | #240 | Tragic 6.4% |
| Immigrants | Haiti | 1.6 /100 | #241 | Tragic 6.5% |
| Spaniards | 1.6 /100 | #242 | Tragic 6.5% |
| Germans | 1.5 /100 | #243 | Tragic 6.5% |
| Immigrants | Panama | 1.5 /100 | #244 | Tragic 6.5% |
| Tlingit-Haida | 1.5 /100 | #245 | Tragic 6.5% |
| Armenians | 1.5 /100 | #246 | Tragic 6.5% |
| Immigrants | Cuba | 1.4 /100 | #247 | Tragic 6.5% |
| Immigrants | Portugal | 1.4 /100 | #248 | Tragic 6.5% |
Demographics Similar to Cape Verdeans by Ambulatory Disability
In terms of ambulatory disability, the demographic groups most similar to Cape Verdeans are Crow (6.9%, a difference of 0.070%), Immigrants from St. Vincent and the Grenadines (6.9%, a difference of 0.19%), Alaskan Athabascan (6.9%, a difference of 0.30%), Cheyenne (6.9%, a difference of 0.42%), and French American Indian (6.9%, a difference of 0.47%).
| Demographics | Rating | Rank | Ambulatory Disability |
| U.S. Virgin Islanders | 0.0 /100 | #287 | Tragic 6.8% |
| Immigrants | Nonimmigrants | 0.0 /100 | #288 | Tragic 6.9% |
| Immigrants | Dominica | 0.0 /100 | #289 | Tragic 6.9% |
| Scotch-Irish | 0.0 /100 | #290 | Tragic 6.9% |
| West Indians | 0.0 /100 | #291 | Tragic 6.9% |
| Cheyenne | 0.0 /100 | #292 | Tragic 6.9% |
| Immigrants | St. Vincent and the Grenadines | 0.0 /100 | #293 | Tragic 6.9% |
| Cape Verdeans | 0.0 /100 | #294 | Tragic 6.9% |
| Crow | 0.0 /100 | #295 | Tragic 6.9% |
| Alaskan Athabascans | 0.0 /100 | #296 | Tragic 6.9% |
| French American Indians | 0.0 /100 | #297 | Tragic 6.9% |
| Immigrants | Grenada | 0.0 /100 | #298 | Tragic 6.9% |
| Puget Sound Salish | 0.0 /100 | #299 | Tragic 6.9% |
| Marshallese | 0.0 /100 | #300 | Tragic 6.9% |
| British West Indians | 0.0 /100 | #301 | Tragic 7.0% |