Immigrants from Guatemala vs Slavic Hearing Disability
COMPARE
Immigrants from Guatemala
Slavic
Hearing Disability
Hearing Disability Comparison
Immigrants from Guatemala
Slavs
2.8%
HEARING DISABILITY
95.1/ 100
METRIC RATING
99th/ 347
METRIC RANK
3.4%
HEARING DISABILITY
0.2/ 100
METRIC RATING
254th/ 347
METRIC RANK
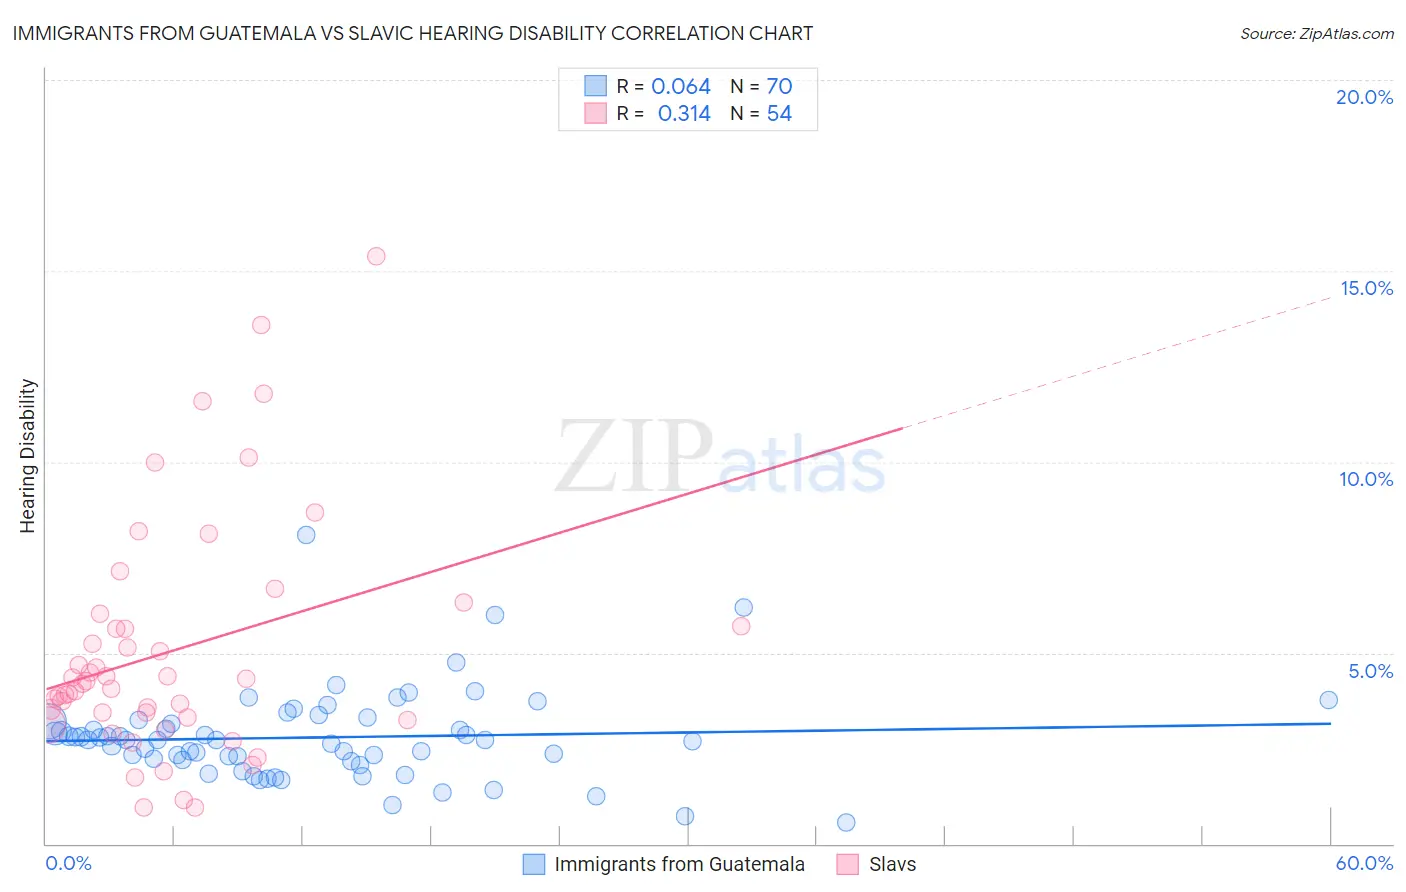
Immigrants from Guatemala vs Slavic Hearing Disability Correlation Chart
The statistical analysis conducted on geographies consisting of 377,187,532 people shows a slight positive correlation between the proportion of Immigrants from Guatemala and percentage of population with hearing disability in the United States with a correlation coefficient (R) of 0.064 and weighted average of 2.8%. Similarly, the statistical analysis conducted on geographies consisting of 270,835,227 people shows a mild positive correlation between the proportion of Slavs and percentage of population with hearing disability in the United States with a correlation coefficient (R) of 0.314 and weighted average of 3.4%, a difference of 22.8%.
Hearing Disability Correlation Summary
| Measurement | Immigrants from Guatemala | Slavic |
| Minimum | 0.55% | 0.96% |
| Maximum | 8.1% | 15.4% |
| Range | 7.5% | 14.4% |
| Mean | 2.8% | 5.0% |
| Median | 2.7% | 4.2% |
| Interquartile 25% (IQ1) | 2.2% | 3.3% |
| Interquartile 75% (IQ3) | 3.2% | 5.7% |
| Interquartile Range (IQR) | 1.0% | 2.4% |
| Standard Deviation (Sample) | 1.2% | 3.1% |
| Standard Deviation (Population) | 1.2% | 3.1% |
Similar Demographics by Hearing Disability
Demographics Similar to Immigrants from Guatemala by Hearing Disability
In terms of hearing disability, the demographic groups most similar to Immigrants from Guatemala are Immigrants from Honduras (2.8%, a difference of 0.040%), Immigrants from Eastern Africa (2.8%, a difference of 0.050%), Immigrants from Afghanistan (2.8%, a difference of 0.10%), Immigrants from Spain (2.8%, a difference of 0.11%), and Taiwanese (2.8%, a difference of 0.12%).
| Demographics | Rating | Rank | Hearing Disability |
| Iranians | 96.4 /100 | #92 | Exceptional 2.8% |
| Immigrants | Kuwait | 96.3 /100 | #93 | Exceptional 2.8% |
| Uruguayans | 95.9 /100 | #94 | Exceptional 2.8% |
| Israelis | 95.9 /100 | #95 | Exceptional 2.8% |
| Immigrants | Somalia | 95.5 /100 | #96 | Exceptional 2.8% |
| Immigrants | Afghanistan | 95.3 /100 | #97 | Exceptional 2.8% |
| Immigrants | Honduras | 95.1 /100 | #98 | Exceptional 2.8% |
| Immigrants | Guatemala | 95.1 /100 | #99 | Exceptional 2.8% |
| Immigrants | Eastern Africa | 95.0 /100 | #100 | Exceptional 2.8% |
| Immigrants | Spain | 94.9 /100 | #101 | Exceptional 2.8% |
| Taiwanese | 94.8 /100 | #102 | Exceptional 2.8% |
| Immigrants | Indonesia | 94.7 /100 | #103 | Exceptional 2.8% |
| Burmese | 94.2 /100 | #104 | Exceptional 2.8% |
| Moroccans | 93.9 /100 | #105 | Exceptional 2.8% |
| Hondurans | 93.4 /100 | #106 | Exceptional 2.8% |
Demographics Similar to Slavs by Hearing Disability
In terms of hearing disability, the demographic groups most similar to Slavs are Polish (3.4%, a difference of 0.23%), Hmong (3.4%, a difference of 0.27%), Carpatho Rusyn (3.4%, a difference of 0.42%), Yaqui (3.4%, a difference of 0.73%), and Northern European (3.4%, a difference of 0.79%).
| Demographics | Rating | Rank | Hearing Disability |
| Lithuanians | 0.6 /100 | #247 | Tragic 3.4% |
| Austrians | 0.6 /100 | #248 | Tragic 3.4% |
| Italians | 0.4 /100 | #249 | Tragic 3.4% |
| Yuman | 0.4 /100 | #250 | Tragic 3.4% |
| Hungarians | 0.4 /100 | #251 | Tragic 3.4% |
| Croatians | 0.4 /100 | #252 | Tragic 3.4% |
| Carpatho Rusyns | 0.3 /100 | #253 | Tragic 3.4% |
| Slavs | 0.2 /100 | #254 | Tragic 3.4% |
| Poles | 0.2 /100 | #255 | Tragic 3.4% |
| Hmong | 0.2 /100 | #256 | Tragic 3.4% |
| Yaqui | 0.2 /100 | #257 | Tragic 3.4% |
| Northern Europeans | 0.2 /100 | #258 | Tragic 3.4% |
| Slovenes | 0.1 /100 | #259 | Tragic 3.5% |
| Portuguese | 0.1 /100 | #260 | Tragic 3.5% |
| Hawaiians | 0.1 /100 | #261 | Tragic 3.5% |