Immigrants from Guatemala vs Immigrants from Venezuela Disability Age 65 to 74
COMPARE
Immigrants from Guatemala
Immigrants from Venezuela
Disability Age 65 to 74
Disability Age 65 to 74 Comparison
Immigrants from Guatemala
Immigrants from Venezuela
25.7%
DISABILITY AGE 65 TO 74
0.1/ 100
METRIC RATING
270th/ 347
METRIC RANK
21.8%
DISABILITY AGE 65 TO 74
99.0/ 100
METRIC RATING
73rd/ 347
METRIC RANK
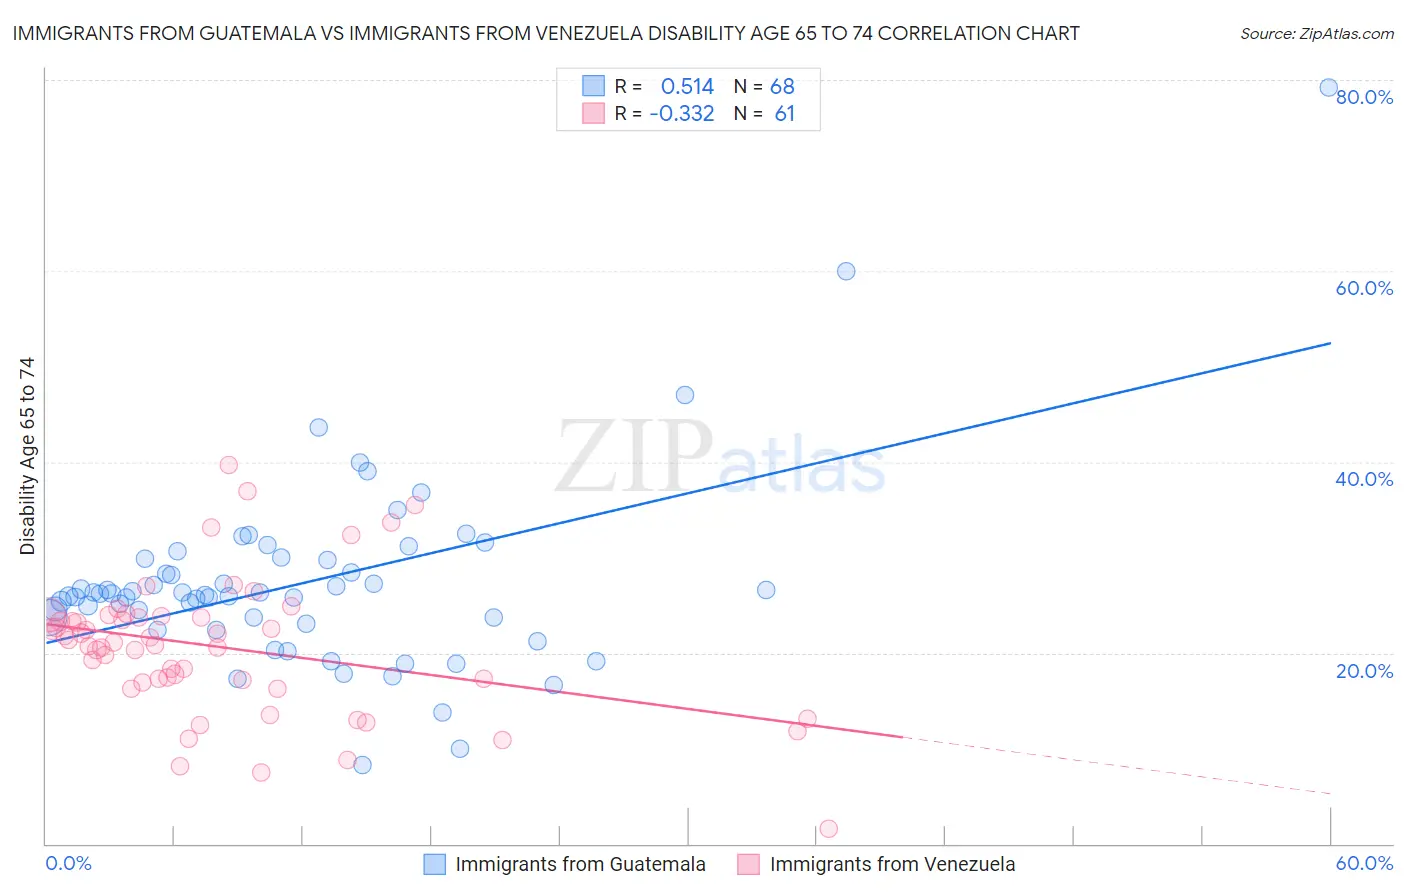
Immigrants from Guatemala vs Immigrants from Venezuela Disability Age 65 to 74 Correlation Chart
The statistical analysis conducted on geographies consisting of 376,919,438 people shows a substantial positive correlation between the proportion of Immigrants from Guatemala and percentage of population with a disability between the ages 65 and 75 in the United States with a correlation coefficient (R) of 0.514 and weighted average of 25.7%. Similarly, the statistical analysis conducted on geographies consisting of 287,548,772 people shows a mild negative correlation between the proportion of Immigrants from Venezuela and percentage of population with a disability between the ages 65 and 75 in the United States with a correlation coefficient (R) of -0.332 and weighted average of 21.8%, a difference of 18.0%.
Disability Age 65 to 74 Correlation Summary
| Measurement | Immigrants from Guatemala | Immigrants from Venezuela |
| Minimum | 8.2% | 1.6% |
| Maximum | 79.2% | 39.7% |
| Range | 71.0% | 38.1% |
| Mean | 27.3% | 20.6% |
| Median | 26.1% | 21.0% |
| Interquartile 25% (IQ1) | 23.3% | 17.0% |
| Interquartile 75% (IQ3) | 29.8% | 23.8% |
| Interquartile Range (IQR) | 6.4% | 6.8% |
| Standard Deviation (Sample) | 10.1% | 7.2% |
| Standard Deviation (Population) | 10.0% | 7.1% |
Similar Demographics by Disability Age 65 to 74
Demographics Similar to Immigrants from Guatemala by Disability Age 65 to 74
In terms of disability age 65 to 74, the demographic groups most similar to Immigrants from Guatemala are Immigrants from Liberia (25.7%, a difference of 0.030%), Immigrants from Dominica (25.7%, a difference of 0.030%), Hmong (25.7%, a difference of 0.080%), Japanese (25.7%, a difference of 0.16%), and Liberian (25.6%, a difference of 0.20%).
| Demographics | Rating | Rank | Disability Age 65 to 74 |
| Iroquois | 0.2 /100 | #263 | Tragic 25.4% |
| Hawaiians | 0.2 /100 | #264 | Tragic 25.5% |
| Guatemalans | 0.2 /100 | #265 | Tragic 25.5% |
| Immigrants | Latin America | 0.1 /100 | #266 | Tragic 25.6% |
| Ottawa | 0.1 /100 | #267 | Tragic 25.6% |
| Liberians | 0.1 /100 | #268 | Tragic 25.6% |
| Hmong | 0.1 /100 | #269 | Tragic 25.7% |
| Immigrants | Guatemala | 0.1 /100 | #270 | Tragic 25.7% |
| Immigrants | Liberia | 0.1 /100 | #271 | Tragic 25.7% |
| Immigrants | Dominica | 0.1 /100 | #272 | Tragic 25.7% |
| Japanese | 0.1 /100 | #273 | Tragic 25.7% |
| Americans | 0.1 /100 | #274 | Tragic 25.8% |
| Hondurans | 0.1 /100 | #275 | Tragic 25.8% |
| French American Indians | 0.1 /100 | #276 | Tragic 25.8% |
| Belizeans | 0.1 /100 | #277 | Tragic 25.8% |
Demographics Similar to Immigrants from Venezuela by Disability Age 65 to 74
In terms of disability age 65 to 74, the demographic groups most similar to Immigrants from Venezuela are Cambodian (21.8%, a difference of 0.010%), Mongolian (21.8%, a difference of 0.030%), Greek (21.8%, a difference of 0.040%), Immigrants from Poland (21.8%, a difference of 0.090%), and Immigrants from Eastern Europe (21.8%, a difference of 0.15%).
| Demographics | Rating | Rank | Disability Age 65 to 74 |
| Maltese | 99.4 /100 | #66 | Exceptional 21.6% |
| Immigrants | South Africa | 99.3 /100 | #67 | Exceptional 21.7% |
| Immigrants | Scotland | 99.3 /100 | #68 | Exceptional 21.7% |
| Immigrants | Egypt | 99.2 /100 | #69 | Exceptional 21.7% |
| Chinese | 99.2 /100 | #70 | Exceptional 21.7% |
| Immigrants | Belarus | 99.2 /100 | #71 | Exceptional 21.7% |
| Immigrants | Hungary | 99.2 /100 | #72 | Exceptional 21.7% |
| Immigrants | Venezuela | 99.0 /100 | #73 | Exceptional 21.8% |
| Cambodians | 99.0 /100 | #74 | Exceptional 21.8% |
| Mongolians | 99.0 /100 | #75 | Exceptional 21.8% |
| Greeks | 99.0 /100 | #76 | Exceptional 21.8% |
| Immigrants | Poland | 99.0 /100 | #77 | Exceptional 21.8% |
| Immigrants | Eastern Europe | 99.0 /100 | #78 | Exceptional 21.8% |
| Venezuelans | 99.0 /100 | #79 | Exceptional 21.8% |
| Immigrants | Norway | 98.9 /100 | #80 | Exceptional 21.8% |