Immigrants from Greece vs Spaniard Disability Age Over 75
COMPARE
Immigrants from Greece
Spaniard
Disability Age Over 75
Disability Age Over 75 Comparison
Immigrants from Greece
Spaniards
45.2%
DISABILITY AGE OVER 75
100.0/ 100
METRIC RATING
19th/ 347
METRIC RANK
48.1%
DISABILITY AGE OVER 75
5.7/ 100
METRIC RATING
229th/ 347
METRIC RANK
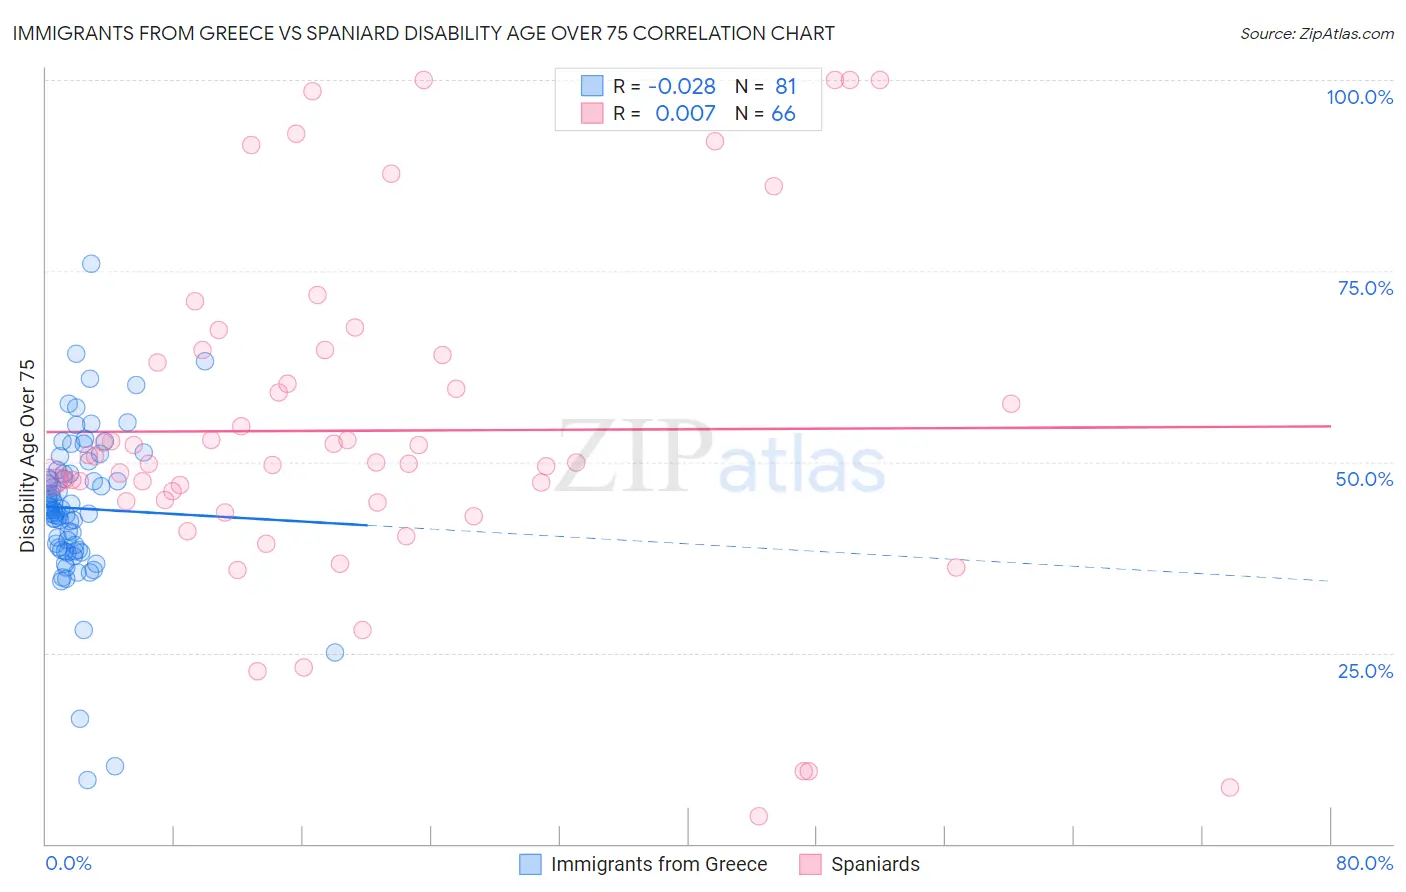
Immigrants from Greece vs Spaniard Disability Age Over 75 Correlation Chart
The statistical analysis conducted on geographies consisting of 216,798,152 people shows no correlation between the proportion of Immigrants from Greece and percentage of population with a disability over the age of 75 in the United States with a correlation coefficient (R) of -0.028 and weighted average of 45.2%. Similarly, the statistical analysis conducted on geographies consisting of 442,367,902 people shows no correlation between the proportion of Spaniards and percentage of population with a disability over the age of 75 in the United States with a correlation coefficient (R) of 0.007 and weighted average of 48.1%, a difference of 6.4%.
Disability Age Over 75 Correlation Summary
| Measurement | Immigrants from Greece | Spaniard |
| Minimum | 8.3% | 3.6% |
| Maximum | 75.9% | 100.0% |
| Range | 67.5% | 96.4% |
| Mean | 43.9% | 54.1% |
| Median | 43.8% | 50.0% |
| Interquartile 25% (IQ1) | 38.5% | 44.8% |
| Interquartile 75% (IQ3) | 48.6% | 64.0% |
| Interquartile Range (IQR) | 10.2% | 19.1% |
| Standard Deviation (Sample) | 10.4% | 22.3% |
| Standard Deviation (Population) | 10.3% | 22.1% |
Similar Demographics by Disability Age Over 75
Demographics Similar to Immigrants from Greece by Disability Age Over 75
In terms of disability age over 75, the demographic groups most similar to Immigrants from Greece are Bolivian (45.2%, a difference of 0.010%), Immigrants from India (45.2%, a difference of 0.030%), Immigrants from Northern Europe (45.2%, a difference of 0.040%), Immigrants from Serbia (45.3%, a difference of 0.11%), and Immigrants from Sweden (45.1%, a difference of 0.14%).
| Demographics | Rating | Rank | Disability Age Over 75 |
| Immigrants | Czechoslovakia | 100.0 /100 | #12 | Exceptional 45.1% |
| Latvians | 100.0 /100 | #13 | Exceptional 45.1% |
| Immigrants | Scotland | 100.0 /100 | #14 | Exceptional 45.1% |
| Immigrants | Sweden | 100.0 /100 | #15 | Exceptional 45.1% |
| Immigrants | Northern Europe | 100.0 /100 | #16 | Exceptional 45.2% |
| Immigrants | India | 100.0 /100 | #17 | Exceptional 45.2% |
| Bolivians | 100.0 /100 | #18 | Exceptional 45.2% |
| Immigrants | Greece | 100.0 /100 | #19 | Exceptional 45.2% |
| Immigrants | Serbia | 100.0 /100 | #20 | Exceptional 45.3% |
| Immigrants | Belgium | 100.0 /100 | #21 | Exceptional 45.3% |
| Immigrants | South Africa | 100.0 /100 | #22 | Exceptional 45.3% |
| Immigrants | Switzerland | 99.9 /100 | #23 | Exceptional 45.3% |
| Poles | 99.9 /100 | #24 | Exceptional 45.3% |
| Immigrants | Bolivia | 99.9 /100 | #25 | Exceptional 45.4% |
| Macedonians | 99.9 /100 | #26 | Exceptional 45.4% |
Demographics Similar to Spaniards by Disability Age Over 75
In terms of disability age over 75, the demographic groups most similar to Spaniards are Immigrants from Liberia (48.1%, a difference of 0.020%), Nonimmigrants (48.0%, a difference of 0.070%), Zimbabwean (48.1%, a difference of 0.070%), Spanish (48.0%, a difference of 0.080%), and Liberian (48.0%, a difference of 0.090%).
| Demographics | Rating | Rank | Disability Age Over 75 |
| Barbadians | 6.8 /100 | #222 | Tragic 48.0% |
| Immigrants | Bangladesh | 6.8 /100 | #223 | Tragic 48.0% |
| Liberians | 6.7 /100 | #224 | Tragic 48.0% |
| Spanish | 6.5 /100 | #225 | Tragic 48.0% |
| Immigrants | Nonimmigrants | 6.5 /100 | #226 | Tragic 48.0% |
| Zimbabweans | 6.4 /100 | #227 | Tragic 48.1% |
| Immigrants | Liberia | 5.9 /100 | #228 | Tragic 48.1% |
| Spaniards | 5.7 /100 | #229 | Tragic 48.1% |
| Taiwanese | 4.4 /100 | #230 | Tragic 48.2% |
| Immigrants | Immigrants | 4.3 /100 | #231 | Tragic 48.2% |
| Indonesians | 4.2 /100 | #232 | Tragic 48.2% |
| Cree | 4.2 /100 | #233 | Tragic 48.2% |
| Sub-Saharan Africans | 3.8 /100 | #234 | Tragic 48.2% |
| Hmong | 3.8 /100 | #235 | Tragic 48.2% |
| Immigrants | Nicaragua | 3.2 /100 | #236 | Tragic 48.2% |