Immigrants from Greece vs Native/Alaskan Male Disability
COMPARE
Immigrants from Greece
Native/Alaskan
Male Disability
Male Disability Comparison
Immigrants from Greece
Natives/Alaskans
10.7%
MALE DISABILITY
95.6/ 100
METRIC RATING
101st/ 347
METRIC RANK
14.2%
MALE DISABILITY
0.0/ 100
METRIC RATING
326th/ 347
METRIC RANK
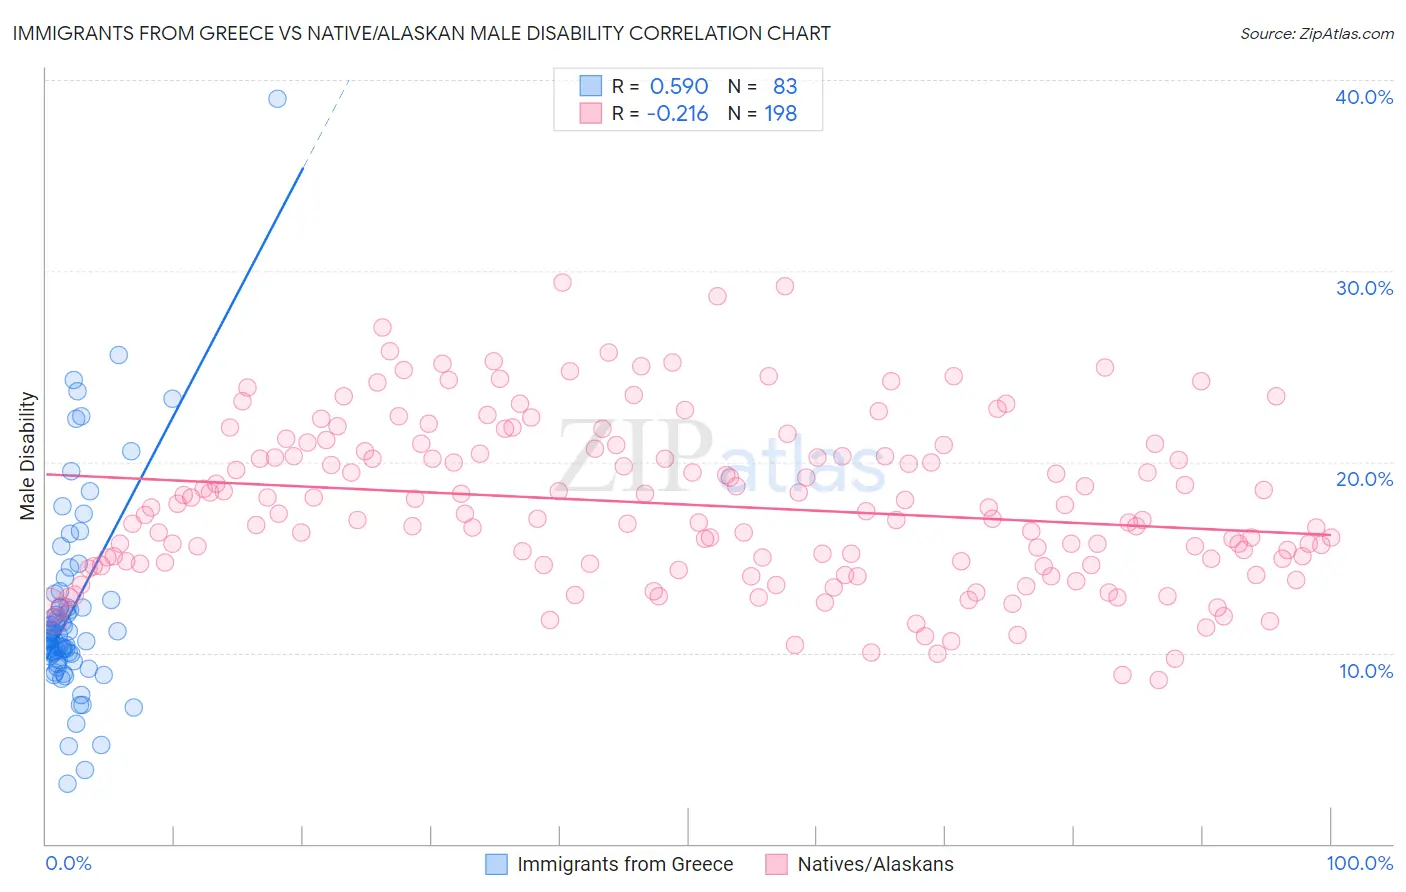
Immigrants from Greece vs Native/Alaskan Male Disability Correlation Chart
The statistical analysis conducted on geographies consisting of 216,877,187 people shows a substantial positive correlation between the proportion of Immigrants from Greece and percentage of males with a disability in the United States with a correlation coefficient (R) of 0.590 and weighted average of 10.7%. Similarly, the statistical analysis conducted on geographies consisting of 512,854,069 people shows a weak negative correlation between the proportion of Natives/Alaskans and percentage of males with a disability in the United States with a correlation coefficient (R) of -0.216 and weighted average of 14.2%, a difference of 32.3%.
Male Disability Correlation Summary
| Measurement | Immigrants from Greece | Native/Alaskan |
| Minimum | 3.1% | 8.6% |
| Maximum | 39.0% | 29.4% |
| Range | 35.9% | 20.8% |
| Mean | 12.3% | 17.8% |
| Median | 11.0% | 17.3% |
| Interquartile 25% (IQ1) | 9.8% | 14.7% |
| Interquartile 75% (IQ3) | 12.8% | 20.5% |
| Interquartile Range (IQR) | 2.9% | 5.9% |
| Standard Deviation (Sample) | 5.4% | 4.3% |
| Standard Deviation (Population) | 5.3% | 4.3% |
Similar Demographics by Male Disability
Demographics Similar to Immigrants from Greece by Male Disability
In terms of male disability, the demographic groups most similar to Immigrants from Greece are Immigrants from Eastern Europe (10.7%, a difference of 0.10%), Immigrants from Kazakhstan (10.7%, a difference of 0.11%), Uruguayan (10.7%, a difference of 0.11%), Immigrants from Nigeria (10.8%, a difference of 0.17%), and Immigrants from Switzerland (10.7%, a difference of 0.18%).
| Demographics | Rating | Rank | Male Disability |
| Immigrants | Sweden | 96.9 /100 | #94 | Exceptional 10.7% |
| Chileans | 96.9 /100 | #95 | Exceptional 10.7% |
| Nicaraguans | 96.6 /100 | #96 | Exceptional 10.7% |
| Immigrants | Armenia | 96.6 /100 | #97 | Exceptional 10.7% |
| Immigrants | Romania | 96.5 /100 | #98 | Exceptional 10.7% |
| Immigrants | Switzerland | 96.1 /100 | #99 | Exceptional 10.7% |
| Immigrants | Kazakhstan | 95.9 /100 | #100 | Exceptional 10.7% |
| Immigrants | Greece | 95.6 /100 | #101 | Exceptional 10.7% |
| Immigrants | Eastern Europe | 95.3 /100 | #102 | Exceptional 10.7% |
| Uruguayans | 95.3 /100 | #103 | Exceptional 10.7% |
| Immigrants | Nigeria | 95.1 /100 | #104 | Exceptional 10.8% |
| Immigrants | Brazil | 95.0 /100 | #105 | Exceptional 10.8% |
| Immigrants | Syria | 94.9 /100 | #106 | Exceptional 10.8% |
| Immigrants | Eastern Africa | 94.3 /100 | #107 | Exceptional 10.8% |
| Immigrants | Belgium | 94.2 /100 | #108 | Exceptional 10.8% |
Demographics Similar to Natives/Alaskans by Male Disability
In terms of male disability, the demographic groups most similar to Natives/Alaskans are Potawatomi (14.2%, a difference of 0.10%), Chippewa (14.3%, a difference of 0.53%), Ottawa (14.1%, a difference of 0.94%), Comanche (14.1%, a difference of 1.1%), and Cajun (14.4%, a difference of 1.1%).
| Demographics | Rating | Rank | Male Disability |
| Americans | 0.0 /100 | #319 | Tragic 13.8% |
| Tlingit-Haida | 0.0 /100 | #320 | Tragic 13.8% |
| Shoshone | 0.0 /100 | #321 | Tragic 13.8% |
| Apache | 0.0 /100 | #322 | Tragic 14.0% |
| Osage | 0.0 /100 | #323 | Tragic 14.0% |
| Comanche | 0.0 /100 | #324 | Tragic 14.1% |
| Ottawa | 0.0 /100 | #325 | Tragic 14.1% |
| Natives/Alaskans | 0.0 /100 | #326 | Tragic 14.2% |
| Potawatomi | 0.0 /100 | #327 | Tragic 14.2% |
| Chippewa | 0.0 /100 | #328 | Tragic 14.3% |
| Cajuns | 0.0 /100 | #329 | Tragic 14.4% |
| Navajo | 0.0 /100 | #330 | Tragic 14.4% |
| Tohono O'odham | 0.0 /100 | #331 | Tragic 14.6% |
| Seminole | 0.0 /100 | #332 | Tragic 14.7% |
| Yuman | 0.0 /100 | #333 | Tragic 14.7% |