Immigrants from Greece vs Immigrants from Zimbabwe Vision Disability
COMPARE
Immigrants from Greece
Immigrants from Zimbabwe
Vision Disability
Vision Disability Comparison
Immigrants from Greece
Immigrants from Zimbabwe
2.0%
VISION DISABILITY
99.0/ 100
METRIC RATING
64th/ 347
METRIC RANK
2.1%
VISION DISABILITY
91.0/ 100
METRIC RATING
120th/ 347
METRIC RANK
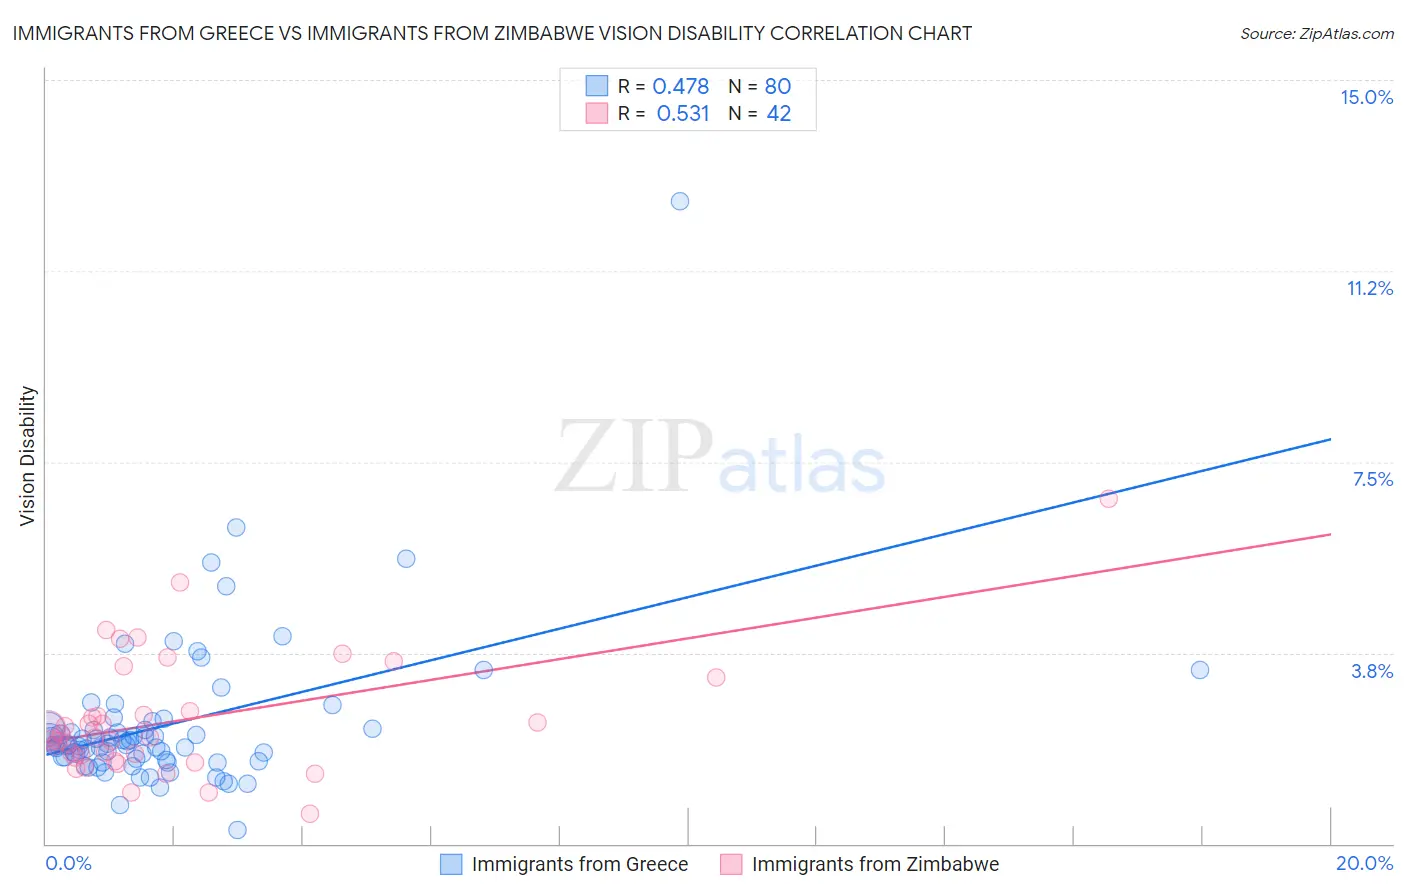
Immigrants from Greece vs Immigrants from Zimbabwe Vision Disability Correlation Chart
The statistical analysis conducted on geographies consisting of 216,813,822 people shows a moderate positive correlation between the proportion of Immigrants from Greece and percentage of population with vision disability in the United States with a correlation coefficient (R) of 0.478 and weighted average of 2.0%. Similarly, the statistical analysis conducted on geographies consisting of 117,800,208 people shows a substantial positive correlation between the proportion of Immigrants from Zimbabwe and percentage of population with vision disability in the United States with a correlation coefficient (R) of 0.531 and weighted average of 2.1%, a difference of 3.8%.
Vision Disability Correlation Summary
| Measurement | Immigrants from Greece | Immigrants from Zimbabwe |
| Minimum | 0.27% | 0.59% |
| Maximum | 12.6% | 6.8% |
| Range | 12.3% | 6.2% |
| Mean | 2.3% | 2.4% |
| Median | 1.9% | 2.1% |
| Interquartile 25% (IQ1) | 1.7% | 1.7% |
| Interquartile 75% (IQ3) | 2.3% | 2.6% |
| Interquartile Range (IQR) | 0.60% | 0.89% |
| Standard Deviation (Sample) | 1.6% | 1.2% |
| Standard Deviation (Population) | 1.6% | 1.2% |
Similar Demographics by Vision Disability
Demographics Similar to Immigrants from Greece by Vision Disability
In terms of vision disability, the demographic groups most similar to Immigrants from Greece are Maltese (2.0%, a difference of 0.070%), Armenian (2.0%, a difference of 0.13%), Immigrants from Argentina (2.0%, a difference of 0.13%), Immigrants from Russia (2.0%, a difference of 0.24%), and Immigrants from Northern Africa (2.0%, a difference of 0.24%).
| Demographics | Rating | Rank | Vision Disability |
| Somalis | 99.2 /100 | #57 | Exceptional 2.0% |
| Immigrants | Saudi Arabia | 99.2 /100 | #58 | Exceptional 2.0% |
| Argentineans | 99.1 /100 | #59 | Exceptional 2.0% |
| Immigrants | Romania | 99.1 /100 | #60 | Exceptional 2.0% |
| Immigrants | Belgium | 99.1 /100 | #61 | Exceptional 2.0% |
| Immigrants | Russia | 99.1 /100 | #62 | Exceptional 2.0% |
| Armenians | 99.0 /100 | #63 | Exceptional 2.0% |
| Immigrants | Greece | 99.0 /100 | #64 | Exceptional 2.0% |
| Maltese | 98.9 /100 | #65 | Exceptional 2.0% |
| Immigrants | Argentina | 98.9 /100 | #66 | Exceptional 2.0% |
| Immigrants | Northern Africa | 98.8 /100 | #67 | Exceptional 2.0% |
| Immigrants | Czechoslovakia | 98.7 /100 | #68 | Exceptional 2.0% |
| Russians | 98.6 /100 | #69 | Exceptional 2.0% |
| Immigrants | Kazakhstan | 98.6 /100 | #70 | Exceptional 2.0% |
| Immigrants | Northern Europe | 98.6 /100 | #71 | Exceptional 2.0% |
Demographics Similar to Immigrants from Zimbabwe by Vision Disability
In terms of vision disability, the demographic groups most similar to Immigrants from Zimbabwe are Immigrants from Uganda (2.1%, a difference of 0.060%), Immigrants from Philippines (2.1%, a difference of 0.070%), Immigrants from Scotland (2.1%, a difference of 0.12%), Immigrants from Ukraine (2.1%, a difference of 0.13%), and Immigrants from Albania (2.1%, a difference of 0.13%).
| Demographics | Rating | Rank | Vision Disability |
| Kenyans | 92.5 /100 | #113 | Exceptional 2.1% |
| Croatians | 92.3 /100 | #114 | Exceptional 2.1% |
| Immigrants | Vietnam | 92.2 /100 | #115 | Exceptional 2.1% |
| Ugandans | 92.2 /100 | #116 | Exceptional 2.1% |
| Poles | 92.0 /100 | #117 | Exceptional 2.1% |
| Immigrants | Philippines | 91.4 /100 | #118 | Exceptional 2.1% |
| Immigrants | Uganda | 91.4 /100 | #119 | Exceptional 2.1% |
| Immigrants | Zimbabwe | 91.0 /100 | #120 | Exceptional 2.1% |
| Immigrants | Scotland | 90.4 /100 | #121 | Exceptional 2.1% |
| Immigrants | Ukraine | 90.4 /100 | #122 | Exceptional 2.1% |
| Immigrants | Albania | 90.4 /100 | #123 | Exceptional 2.1% |
| Immigrants | Spain | 89.8 /100 | #124 | Excellent 2.1% |
| Immigrants | Venezuela | 89.8 /100 | #125 | Excellent 2.1% |
| Immigrants | Peru | 89.5 /100 | #126 | Excellent 2.1% |
| Sudanese | 89.2 /100 | #127 | Excellent 2.1% |