Immigrants from Ghana vs Czechoslovakian Ambulatory Disability
COMPARE
Immigrants from Ghana
Czechoslovakian
Ambulatory Disability
Ambulatory Disability Comparison
Immigrants from Ghana
Czechoslovakians
6.1%
AMBULATORY DISABILITY
41.2/ 100
METRIC RATING
184th/ 347
METRIC RANK
6.4%
AMBULATORY DISABILITY
3.8/ 100
METRIC RATING
229th/ 347
METRIC RANK
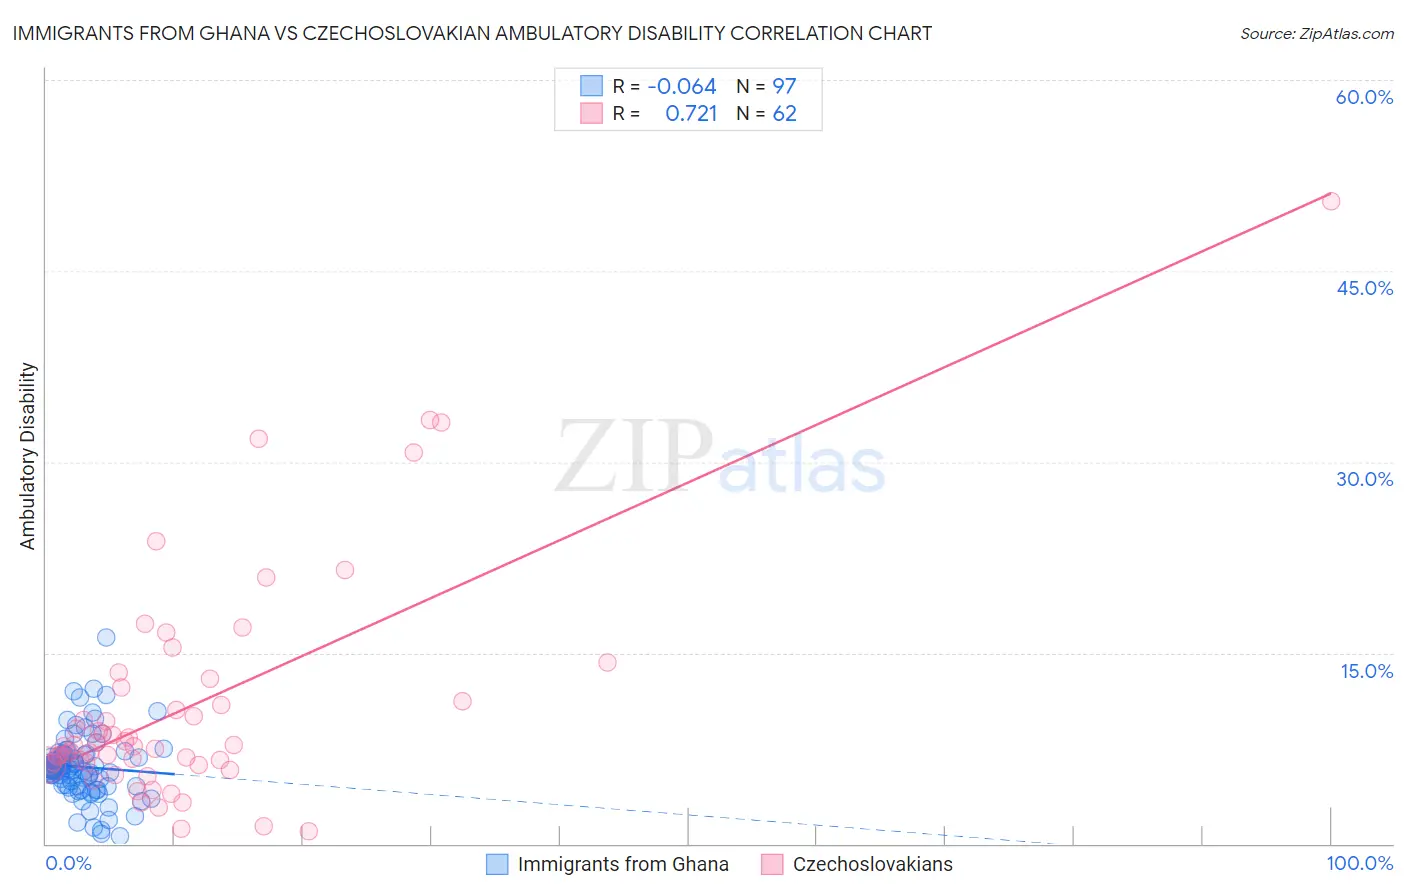
Immigrants from Ghana vs Czechoslovakian Ambulatory Disability Correlation Chart
The statistical analysis conducted on geographies consisting of 199,872,719 people shows a slight negative correlation between the proportion of Immigrants from Ghana and percentage of population with ambulatory disability in the United States with a correlation coefficient (R) of -0.064 and weighted average of 6.1%. Similarly, the statistical analysis conducted on geographies consisting of 368,636,980 people shows a strong positive correlation between the proportion of Czechoslovakians and percentage of population with ambulatory disability in the United States with a correlation coefficient (R) of 0.721 and weighted average of 6.4%, a difference of 3.8%.
Ambulatory Disability Correlation Summary
| Measurement | Immigrants from Ghana | Czechoslovakian |
| Minimum | 0.61% | 0.94% |
| Maximum | 16.2% | 50.5% |
| Range | 15.6% | 49.6% |
| Mean | 6.0% | 10.8% |
| Median | 5.9% | 7.7% |
| Interquartile 25% (IQ1) | 4.6% | 6.3% |
| Interquartile 75% (IQ3) | 7.0% | 12.3% |
| Interquartile Range (IQR) | 2.4% | 6.0% |
| Standard Deviation (Sample) | 2.5% | 9.1% |
| Standard Deviation (Population) | 2.5% | 9.0% |
Similar Demographics by Ambulatory Disability
Demographics Similar to Immigrants from Ghana by Ambulatory Disability
In terms of ambulatory disability, the demographic groups most similar to Immigrants from Ghana are Immigrants from Thailand (6.1%, a difference of 0.050%), Serbian (6.1%, a difference of 0.090%), Swiss (6.1%, a difference of 0.10%), Austrian (6.1%, a difference of 0.15%), and Immigrants from Nicaragua (6.1%, a difference of 0.15%).
| Demographics | Rating | Rank | Ambulatory Disability |
| Immigrants | England | 45.4 /100 | #177 | Average 6.1% |
| Scandinavians | 44.5 /100 | #178 | Average 6.1% |
| Austrians | 44.1 /100 | #179 | Average 6.1% |
| Immigrants | Nicaragua | 43.9 /100 | #180 | Average 6.1% |
| Swiss | 43.1 /100 | #181 | Average 6.1% |
| Serbians | 42.8 /100 | #182 | Average 6.1% |
| Immigrants | Thailand | 42.2 /100 | #183 | Average 6.1% |
| Immigrants | Ghana | 41.2 /100 | #184 | Average 6.1% |
| Immigrants | Bosnia and Herzegovina | 37.2 /100 | #185 | Fair 6.2% |
| Europeans | 36.2 /100 | #186 | Fair 6.2% |
| Carpatho Rusyns | 35.3 /100 | #187 | Fair 6.2% |
| British | 34.3 /100 | #188 | Fair 6.2% |
| Ukrainians | 34.0 /100 | #189 | Fair 6.2% |
| Immigrants | Western Africa | 33.4 /100 | #190 | Fair 6.2% |
| Immigrants | Guatemala | 31.9 /100 | #191 | Fair 6.2% |
Demographics Similar to Czechoslovakians by Ambulatory Disability
In terms of ambulatory disability, the demographic groups most similar to Czechoslovakians are Portuguese (6.4%, a difference of 0.050%), Cuban (6.4%, a difference of 0.060%), Mexican (6.4%, a difference of 0.11%), Panamanian (6.4%, a difference of 0.26%), and Slavic (6.4%, a difference of 0.39%).
| Demographics | Rating | Rank | Ambulatory Disability |
| German Russians | 9.4 /100 | #222 | Tragic 6.3% |
| Immigrants | Honduras | 7.6 /100 | #223 | Tragic 6.3% |
| Liberians | 7.1 /100 | #224 | Tragic 6.3% |
| Hondurans | 6.3 /100 | #225 | Tragic 6.3% |
| Slavs | 5.1 /100 | #226 | Tragic 6.4% |
| Cubans | 4.0 /100 | #227 | Tragic 6.4% |
| Portuguese | 4.0 /100 | #228 | Tragic 6.4% |
| Czechoslovakians | 3.8 /100 | #229 | Tragic 6.4% |
| Mexicans | 3.5 /100 | #230 | Tragic 6.4% |
| Panamanians | 3.1 /100 | #231 | Tragic 6.4% |
| Assyrians/Chaldeans/Syriacs | 2.4 /100 | #232 | Tragic 6.4% |
| Sub-Saharan Africans | 2.3 /100 | #233 | Tragic 6.4% |
| Immigrants | Liberia | 2.3 /100 | #234 | Tragic 6.4% |
| Hispanics or Latinos | 2.2 /100 | #235 | Tragic 6.4% |
| Dutch | 2.0 /100 | #236 | Tragic 6.4% |