Immigrants from Germany vs Immigrants from Bolivia Female Disability
COMPARE
Immigrants from Germany
Immigrants from Bolivia
Female Disability
Female Disability Comparison
Immigrants from Germany
Immigrants from Bolivia
12.7%
FEMALE DISABILITY
1.3/ 100
METRIC RATING
255th/ 347
METRIC RANK
10.3%
FEMALE DISABILITY
100.0/ 100
METRIC RATING
5th/ 347
METRIC RANK
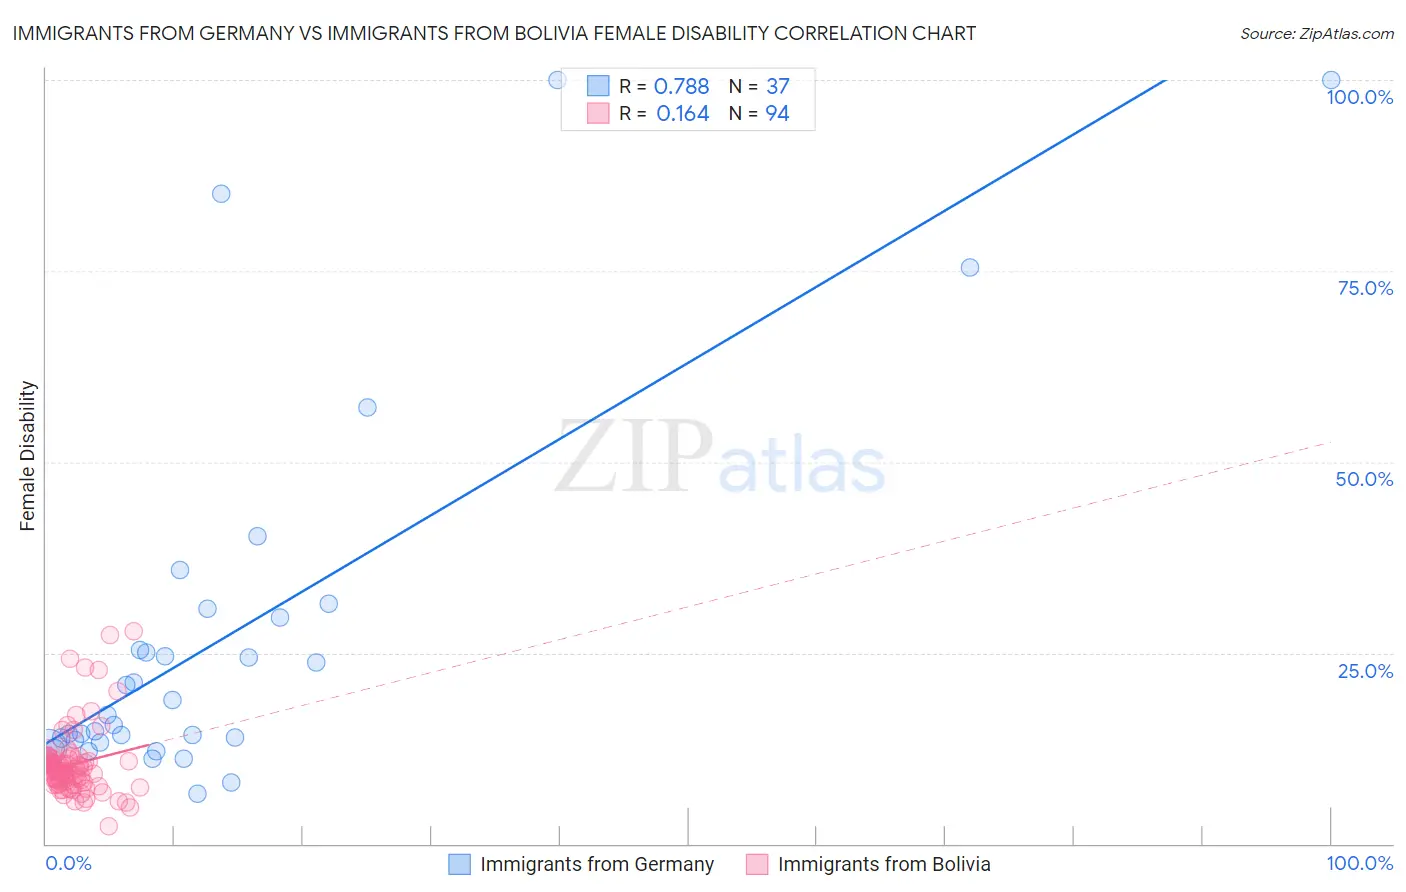
Immigrants from Germany vs Immigrants from Bolivia Female Disability Correlation Chart
The statistical analysis conducted on geographies consisting of 463,857,992 people shows a strong positive correlation between the proportion of Immigrants from Germany and percentage of females with a disability in the United States with a correlation coefficient (R) of 0.788 and weighted average of 12.7%. Similarly, the statistical analysis conducted on geographies consisting of 158,717,377 people shows a poor positive correlation between the proportion of Immigrants from Bolivia and percentage of females with a disability in the United States with a correlation coefficient (R) of 0.164 and weighted average of 10.3%, a difference of 23.8%.
Female Disability Correlation Summary
| Measurement | Immigrants from Germany | Immigrants from Bolivia |
| Minimum | 6.6% | 2.3% |
| Maximum | 100.0% | 27.8% |
| Range | 93.4% | 25.5% |
| Mean | 27.4% | 10.4% |
| Median | 16.9% | 9.5% |
| Interquartile 25% (IQ1) | 13.4% | 8.0% |
| Interquartile 75% (IQ3) | 30.2% | 10.9% |
| Interquartile Range (IQR) | 16.8% | 2.9% |
| Standard Deviation (Sample) | 24.5% | 4.4% |
| Standard Deviation (Population) | 24.2% | 4.4% |
Similar Demographics by Female Disability
Demographics Similar to Immigrants from Germany by Female Disability
In terms of female disability, the demographic groups most similar to Immigrants from Germany are British West Indian (12.7%, a difference of 0.070%), Hawaiian (12.7%, a difference of 0.080%), Liberian (12.7%, a difference of 0.10%), Aleut (12.7%, a difference of 0.10%), and Jamaican (12.7%, a difference of 0.11%).
| Demographics | Rating | Rank | Female Disability |
| Carpatho Rusyns | 2.0 /100 | #248 | Tragic 12.6% |
| Immigrants | Congo | 1.8 /100 | #249 | Tragic 12.7% |
| Slovenes | 1.7 /100 | #250 | Tragic 12.7% |
| Crow | 1.6 /100 | #251 | Tragic 12.7% |
| Immigrants | Caribbean | 1.4 /100 | #252 | Tragic 12.7% |
| Jamaicans | 1.4 /100 | #253 | Tragic 12.7% |
| Hawaiians | 1.4 /100 | #254 | Tragic 12.7% |
| Immigrants | Germany | 1.3 /100 | #255 | Tragic 12.7% |
| British West Indians | 1.2 /100 | #256 | Tragic 12.7% |
| Liberians | 1.1 /100 | #257 | Tragic 12.7% |
| Aleuts | 1.1 /100 | #258 | Tragic 12.7% |
| Immigrants | Armenia | 1.0 /100 | #259 | Tragic 12.7% |
| Sub-Saharan Africans | 1.0 /100 | #260 | Tragic 12.7% |
| Bermudans | 1.0 /100 | #261 | Tragic 12.7% |
| Czechoslovakians | 0.9 /100 | #262 | Tragic 12.7% |
Demographics Similar to Immigrants from Bolivia by Female Disability
In terms of female disability, the demographic groups most similar to Immigrants from Bolivia are Thai (10.2%, a difference of 0.82%), Bolivian (10.4%, a difference of 0.91%), Immigrants from Singapore (10.4%, a difference of 1.7%), Immigrants from Taiwan (10.1%, a difference of 1.7%), and Immigrants from South Central Asia (10.5%, a difference of 1.9%).
| Demographics | Rating | Rank | Female Disability |
| Immigrants | India | 100.0 /100 | #1 | Exceptional 10.0% |
| Filipinos | 100.0 /100 | #2 | Exceptional 10.1% |
| Immigrants | Taiwan | 100.0 /100 | #3 | Exceptional 10.1% |
| Thais | 100.0 /100 | #4 | Exceptional 10.2% |
| Immigrants | Bolivia | 100.0 /100 | #5 | Exceptional 10.3% |
| Bolivians | 100.0 /100 | #6 | Exceptional 10.4% |
| Immigrants | Singapore | 100.0 /100 | #7 | Exceptional 10.4% |
| Immigrants | South Central Asia | 100.0 /100 | #8 | Exceptional 10.5% |
| Iranians | 100.0 /100 | #9 | Exceptional 10.6% |
| Immigrants | Hong Kong | 100.0 /100 | #10 | Exceptional 10.6% |
| Immigrants | Korea | 100.0 /100 | #11 | Exceptional 10.6% |
| Immigrants | Israel | 100.0 /100 | #12 | Exceptional 10.7% |
| Immigrants | Eastern Asia | 100.0 /100 | #13 | Exceptional 10.7% |
| Immigrants | China | 100.0 /100 | #14 | Exceptional 10.7% |
| Burmese | 100.0 /100 | #15 | Exceptional 10.7% |