Immigrants from France vs Eastern European Female Disability
COMPARE
Immigrants from France
Eastern European
Female Disability
Female Disability Comparison
Immigrants from France
Eastern Europeans
11.4%
FEMALE DISABILITY
99.9/ 100
METRIC RATING
61st/ 347
METRIC RANK
11.5%
FEMALE DISABILITY
99.7/ 100
METRIC RATING
81st/ 347
METRIC RANK
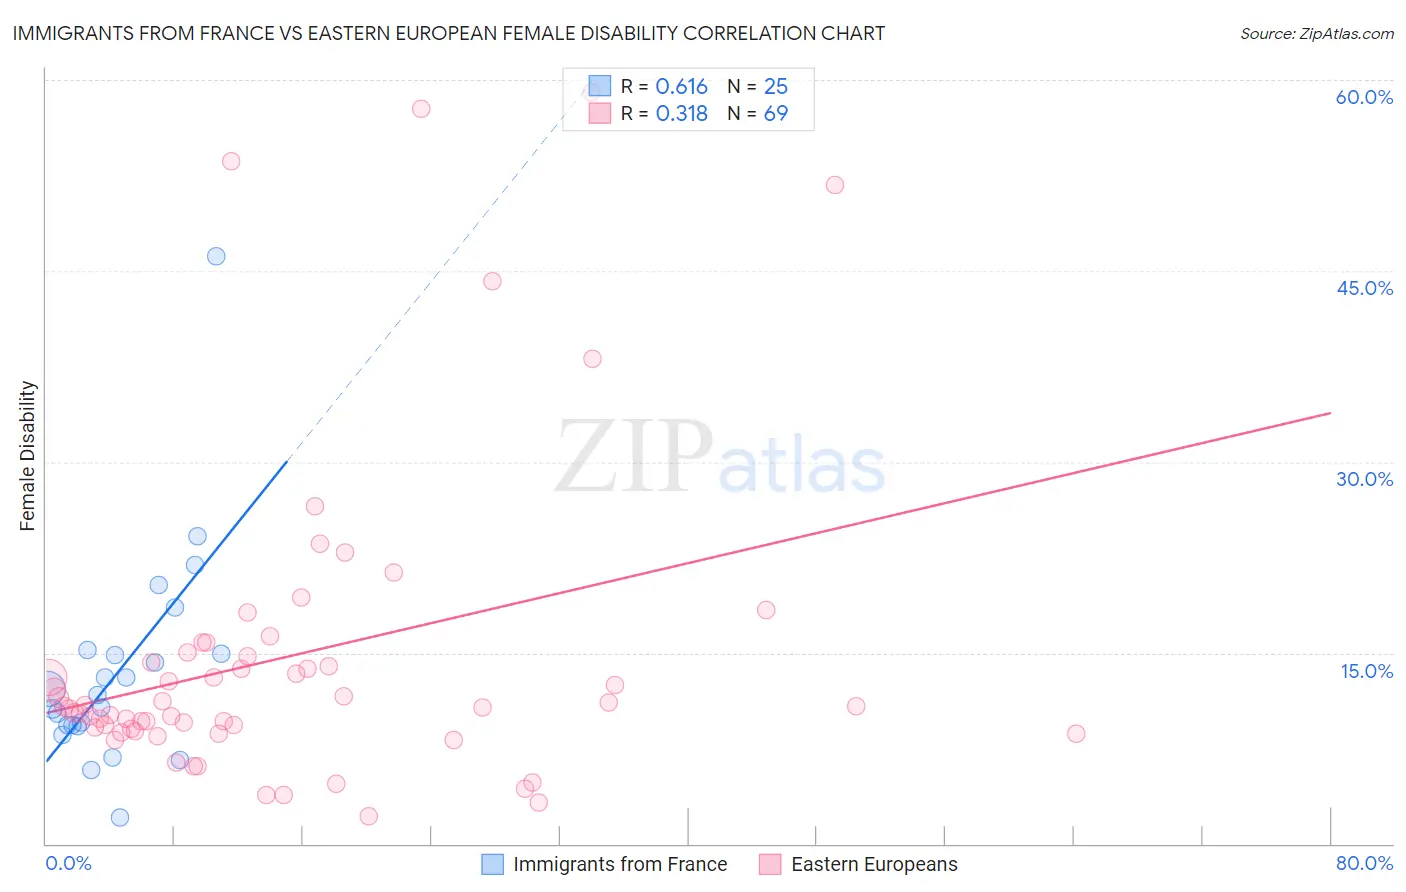
Immigrants from France vs Eastern European Female Disability Correlation Chart
The statistical analysis conducted on geographies consisting of 287,899,826 people shows a significant positive correlation between the proportion of Immigrants from France and percentage of females with a disability in the United States with a correlation coefficient (R) of 0.616 and weighted average of 11.4%. Similarly, the statistical analysis conducted on geographies consisting of 461,176,022 people shows a mild positive correlation between the proportion of Eastern Europeans and percentage of females with a disability in the United States with a correlation coefficient (R) of 0.318 and weighted average of 11.5%, a difference of 1.1%.
Female Disability Correlation Summary
| Measurement | Immigrants from France | Eastern European |
| Minimum | 2.1% | 2.2% |
| Maximum | 46.2% | 59.0% |
| Range | 44.1% | 56.8% |
| Mean | 13.6% | 14.7% |
| Median | 11.7% | 10.8% |
| Interquartile 25% (IQ1) | 9.3% | 8.9% |
| Interquartile 75% (IQ3) | 15.0% | 14.8% |
| Interquartile Range (IQR) | 5.8% | 5.9% |
| Standard Deviation (Sample) | 8.5% | 12.3% |
| Standard Deviation (Population) | 8.3% | 12.2% |
Demographics Similar to Immigrants from France and Eastern Europeans by Female Disability
In terms of female disability, the demographic groups most similar to Immigrants from France are Sri Lankan (11.4%, a difference of 0.10%), Immigrants from Colombia (11.4%, a difference of 0.20%), Immigrants from El Salvador (11.4%, a difference of 0.27%), Immigrants from South America (11.4%, a difference of 0.29%), and Salvadoran (11.5%, a difference of 0.46%). Similarly, the demographic groups most similar to Eastern Europeans are Immigrants from Jordan (11.5%, a difference of 0.14%), Sierra Leonean (11.5%, a difference of 0.15%), Immigrants from South Africa (11.5%, a difference of 0.17%), Immigrants from Eritrea (11.5%, a difference of 0.18%), and Immigrants from Afghanistan (11.5%, a difference of 0.18%).
| Demographics | Rating | Rank | Female Disability |
| Immigrants | France | 99.9 /100 | #61 | Exceptional 11.4% |
| Sri Lankans | 99.9 /100 | #62 | Exceptional 11.4% |
| Immigrants | Colombia | 99.9 /100 | #63 | Exceptional 11.4% |
| Immigrants | El Salvador | 99.9 /100 | #64 | Exceptional 11.4% |
| Immigrants | South America | 99.9 /100 | #65 | Exceptional 11.4% |
| Salvadorans | 99.8 /100 | #66 | Exceptional 11.5% |
| Immigrants | Vietnam | 99.8 /100 | #67 | Exceptional 11.5% |
| Immigrants | Northern Africa | 99.8 /100 | #68 | Exceptional 11.5% |
| Colombians | 99.8 /100 | #69 | Exceptional 11.5% |
| Immigrants | Chile | 99.8 /100 | #70 | Exceptional 11.5% |
| Immigrants | Ireland | 99.8 /100 | #71 | Exceptional 11.5% |
| Chileans | 99.8 /100 | #72 | Exceptional 11.5% |
| Immigrants | Switzerland | 99.8 /100 | #73 | Exceptional 11.5% |
| Bhutanese | 99.8 /100 | #74 | Exceptional 11.5% |
| Immigrants | Lebanon | 99.7 /100 | #75 | Exceptional 11.5% |
| Immigrants | Eritrea | 99.7 /100 | #76 | Exceptional 11.5% |
| Immigrants | Afghanistan | 99.7 /100 | #77 | Exceptional 11.5% |
| Immigrants | South Africa | 99.7 /100 | #78 | Exceptional 11.5% |
| Sierra Leoneans | 99.7 /100 | #79 | Exceptional 11.5% |
| Immigrants | Jordan | 99.7 /100 | #80 | Exceptional 11.5% |
| Eastern Europeans | 99.7 /100 | #81 | Exceptional 11.5% |