Immigrants from France vs Black/African American Hearing Disability
COMPARE
Immigrants from France
Black/African American
Hearing Disability
Hearing Disability Comparison
Immigrants from France
Blacks/African Americans
2.9%
HEARING DISABILITY
73.1/ 100
METRIC RATING
151st/ 347
METRIC RANK
3.0%
HEARING DISABILITY
34.7/ 100
METRIC RATING
187th/ 347
METRIC RANK
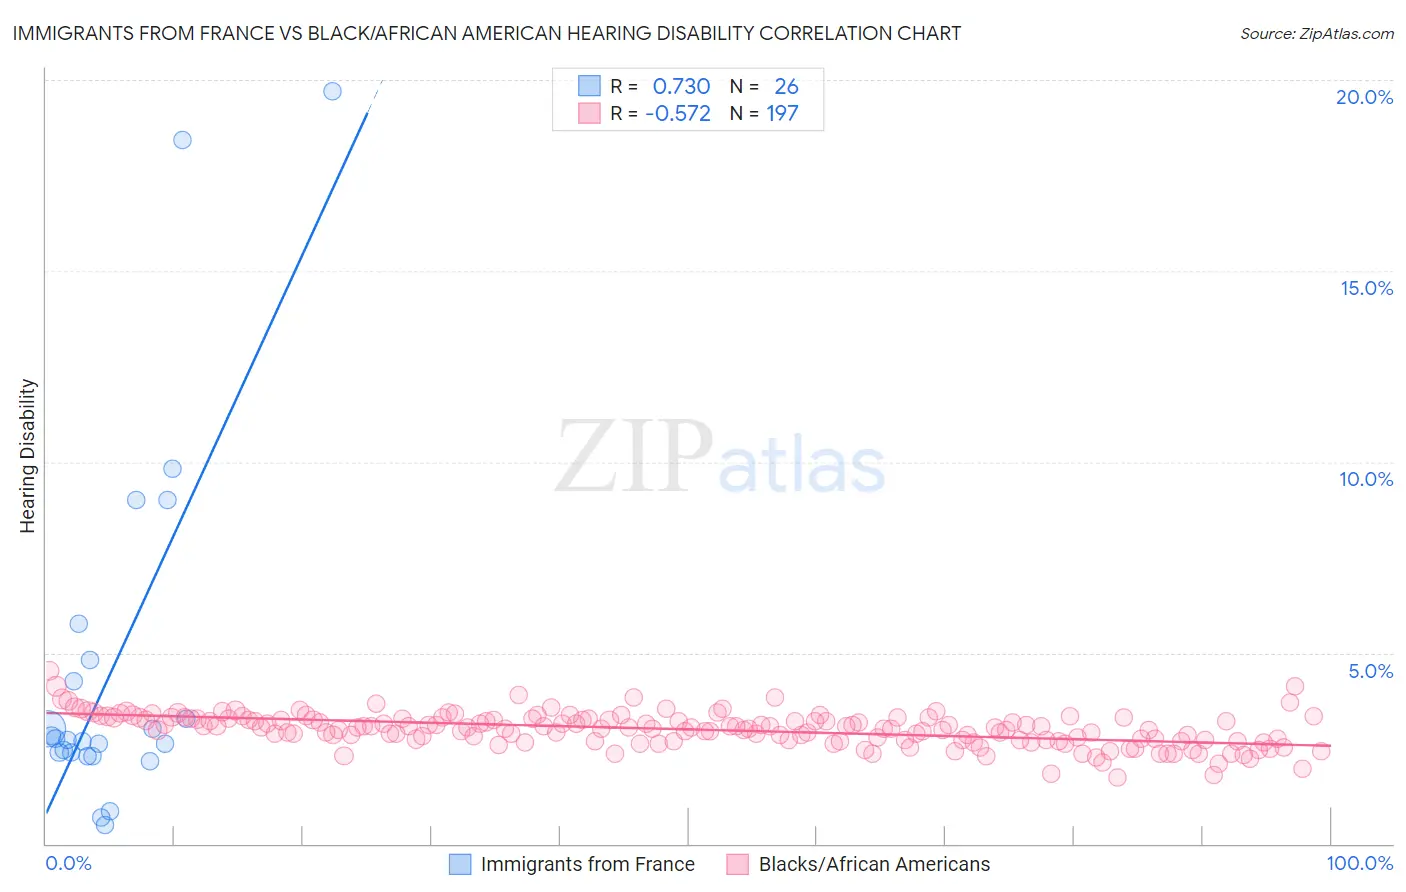
Immigrants from France vs Black/African American Hearing Disability Correlation Chart
The statistical analysis conducted on geographies consisting of 287,858,802 people shows a strong positive correlation between the proportion of Immigrants from France and percentage of population with hearing disability in the United States with a correlation coefficient (R) of 0.730 and weighted average of 2.9%. Similarly, the statistical analysis conducted on geographies consisting of 565,046,012 people shows a substantial negative correlation between the proportion of Blacks/African Americans and percentage of population with hearing disability in the United States with a correlation coefficient (R) of -0.572 and weighted average of 3.0%, a difference of 3.9%.
Hearing Disability Correlation Summary
| Measurement | Immigrants from France | Black/African American |
| Minimum | 0.48% | 1.7% |
| Maximum | 19.7% | 4.5% |
| Range | 19.2% | 2.8% |
| Mean | 4.7% | 3.0% |
| Median | 2.7% | 3.0% |
| Interquartile 25% (IQ1) | 2.4% | 2.7% |
| Interquartile 75% (IQ3) | 4.8% | 3.3% |
| Interquartile Range (IQR) | 2.4% | 0.56% |
| Standard Deviation (Sample) | 4.9% | 0.43% |
| Standard Deviation (Population) | 4.8% | 0.43% |
Similar Demographics by Hearing Disability
Demographics Similar to Immigrants from France by Hearing Disability
In terms of hearing disability, the demographic groups most similar to Immigrants from France are Immigrants from Lithuania (2.9%, a difference of 0.010%), Palestinian (2.9%, a difference of 0.060%), Sudanese (2.9%, a difference of 0.12%), Immigrants from Lebanon (2.9%, a difference of 0.19%), and Costa Rican (2.9%, a difference of 0.21%).
| Demographics | Rating | Rank | Hearing Disability |
| Immigrants | Bulgaria | 79.2 /100 | #144 | Good 2.9% |
| Immigrants | Congo | 78.9 /100 | #145 | Good 2.9% |
| Brazilians | 78.7 /100 | #146 | Good 2.9% |
| Tongans | 78.6 /100 | #147 | Good 2.9% |
| Immigrants | Russia | 77.7 /100 | #148 | Good 2.9% |
| Immigrants | Panama | 76.9 /100 | #149 | Good 2.9% |
| Palestinians | 73.6 /100 | #150 | Good 2.9% |
| Immigrants | France | 73.1 /100 | #151 | Good 2.9% |
| Immigrants | Lithuania | 73.0 /100 | #152 | Good 2.9% |
| Sudanese | 72.1 /100 | #153 | Good 2.9% |
| Immigrants | Lebanon | 71.5 /100 | #154 | Good 2.9% |
| Costa Ricans | 71.4 /100 | #155 | Good 2.9% |
| Immigrants | Poland | 70.2 /100 | #156 | Good 2.9% |
| Immigrants | Kazakhstan | 69.6 /100 | #157 | Good 2.9% |
| Immigrants | Burma/Myanmar | 69.5 /100 | #158 | Good 2.9% |
Demographics Similar to Blacks/African Americans by Hearing Disability
In terms of hearing disability, the demographic groups most similar to Blacks/African Americans are Immigrants from Mexico (3.0%, a difference of 0.010%), Mexican American Indian (3.0%, a difference of 0.010%), Immigrants from Southern Europe (3.0%, a difference of 0.060%), African (3.0%, a difference of 0.19%), and Immigrants from Ireland (3.0%, a difference of 0.27%).
| Demographics | Rating | Rank | Hearing Disability |
| Immigrants | Sweden | 42.4 /100 | #180 | Average 3.0% |
| Immigrants | Belgium | 41.5 /100 | #181 | Average 3.0% |
| Immigrants | Italy | 41.1 /100 | #182 | Average 3.0% |
| Bulgarians | 39.7 /100 | #183 | Fair 3.0% |
| Immigrants | Ireland | 37.4 /100 | #184 | Fair 3.0% |
| Immigrants | Southern Europe | 35.3 /100 | #185 | Fair 3.0% |
| Immigrants | Mexico | 34.9 /100 | #186 | Fair 3.0% |
| Blacks/African Americans | 34.7 /100 | #187 | Fair 3.0% |
| Mexican American Indians | 34.7 /100 | #188 | Fair 3.0% |
| Africans | 32.9 /100 | #189 | Fair 3.0% |
| Immigrants | South Africa | 31.1 /100 | #190 | Fair 3.1% |
| Immigrants | Switzerland | 28.8 /100 | #191 | Fair 3.1% |
| Koreans | 27.6 /100 | #192 | Fair 3.1% |
| Macedonians | 27.0 /100 | #193 | Fair 3.1% |
| South Africans | 24.5 /100 | #194 | Fair 3.1% |