Immigrants from Ethiopia vs Immigrants from Trinidad and Tobago Disability Age 65 to 74
COMPARE
Immigrants from Ethiopia
Immigrants from Trinidad and Tobago
Disability Age 65 to 74
Disability Age 65 to 74 Comparison
Immigrants from Ethiopia
Immigrants from Trinidad and Tobago
22.7%
DISABILITY AGE 65 TO 74
85.3/ 100
METRIC RATING
142nd/ 347
METRIC RANK
23.7%
DISABILITY AGE 65 TO 74
26.1/ 100
METRIC RATING
196th/ 347
METRIC RANK
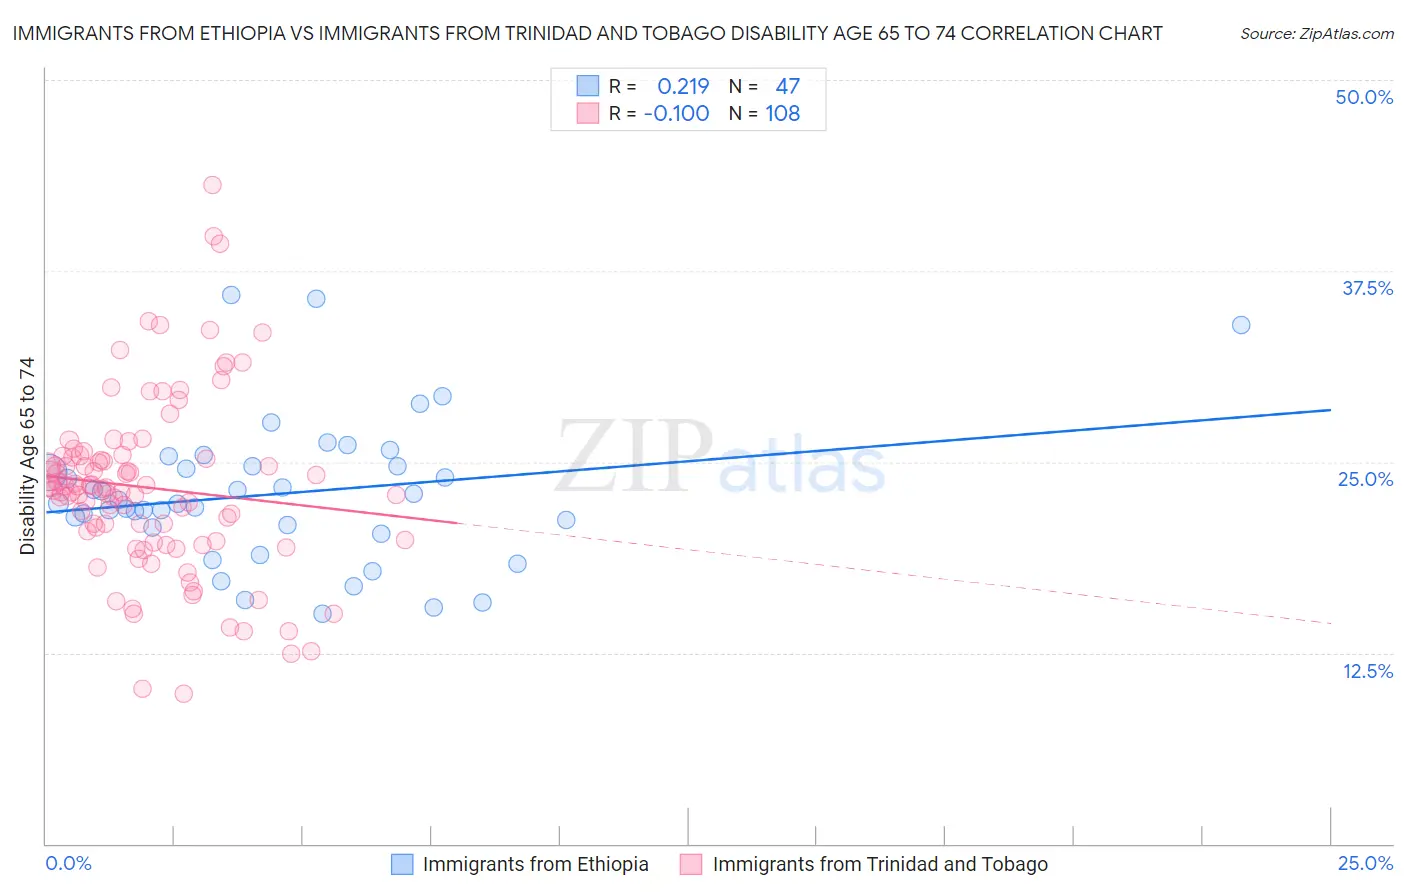
Immigrants from Ethiopia vs Immigrants from Trinidad and Tobago Disability Age 65 to 74 Correlation Chart
The statistical analysis conducted on geographies consisting of 211,341,369 people shows a weak positive correlation between the proportion of Immigrants from Ethiopia and percentage of population with a disability between the ages 65 and 75 in the United States with a correlation coefficient (R) of 0.219 and weighted average of 22.7%. Similarly, the statistical analysis conducted on geographies consisting of 223,307,816 people shows a poor negative correlation between the proportion of Immigrants from Trinidad and Tobago and percentage of population with a disability between the ages 65 and 75 in the United States with a correlation coefficient (R) of -0.100 and weighted average of 23.7%, a difference of 4.2%.
Disability Age 65 to 74 Correlation Summary
| Measurement | Immigrants from Ethiopia | Immigrants from Trinidad and Tobago |
| Minimum | 15.1% | 9.9% |
| Maximum | 35.9% | 43.1% |
| Range | 20.9% | 33.2% |
| Mean | 22.9% | 23.3% |
| Median | 22.3% | 23.3% |
| Interquartile 25% (IQ1) | 20.7% | 19.8% |
| Interquartile 75% (IQ3) | 24.7% | 25.3% |
| Interquartile Range (IQR) | 4.0% | 5.5% |
| Standard Deviation (Sample) | 4.7% | 5.8% |
| Standard Deviation (Population) | 4.6% | 5.8% |
Similar Demographics by Disability Age 65 to 74
Demographics Similar to Immigrants from Ethiopia by Disability Age 65 to 74
In terms of disability age 65 to 74, the demographic groups most similar to Immigrants from Ethiopia are Belgian (22.7%, a difference of 0.010%), Ugandan (22.7%, a difference of 0.020%), Immigrants from Syria (22.7%, a difference of 0.060%), Arab (22.8%, a difference of 0.060%), and Danish (22.8%, a difference of 0.11%).
| Demographics | Rating | Rank | Disability Age 65 to 74 |
| Immigrants | Ukraine | 88.4 /100 | #135 | Excellent 22.6% |
| Ethiopians | 87.9 /100 | #136 | Excellent 22.7% |
| Taiwanese | 87.6 /100 | #137 | Excellent 22.7% |
| Immigrants | Moldova | 87.3 /100 | #138 | Excellent 22.7% |
| Immigrants | Syria | 85.8 /100 | #139 | Excellent 22.7% |
| Ugandans | 85.4 /100 | #140 | Excellent 22.7% |
| Belgians | 85.3 /100 | #141 | Excellent 22.7% |
| Immigrants | Ethiopia | 85.3 /100 | #142 | Excellent 22.7% |
| Arabs | 84.8 /100 | #143 | Excellent 22.8% |
| Danes | 84.4 /100 | #144 | Excellent 22.8% |
| Immigrants | Uganda | 84.0 /100 | #145 | Excellent 22.8% |
| Alsatians | 83.7 /100 | #146 | Excellent 22.8% |
| Immigrants | Uzbekistan | 83.1 /100 | #147 | Excellent 22.8% |
| New Zealanders | 79.9 /100 | #148 | Good 22.9% |
| Swiss | 79.7 /100 | #149 | Good 22.9% |
Demographics Similar to Immigrants from Trinidad and Tobago by Disability Age 65 to 74
In terms of disability age 65 to 74, the demographic groups most similar to Immigrants from Trinidad and Tobago are Immigrants from St. Vincent and the Grenadines (23.7%, a difference of 0.0%), Immigrants (23.7%, a difference of 0.020%), Sudanese (23.7%, a difference of 0.13%), Immigrants from Africa (23.7%, a difference of 0.13%), and Welsh (23.7%, a difference of 0.13%).
| Demographics | Rating | Rank | Disability Age 65 to 74 |
| Scottish | 33.1 /100 | #189 | Fair 23.6% |
| Immigrants | Guyana | 31.2 /100 | #190 | Fair 23.6% |
| Immigrants | Bangladesh | 30.2 /100 | #191 | Fair 23.6% |
| Ecuadorians | 29.7 /100 | #192 | Fair 23.6% |
| English | 28.5 /100 | #193 | Fair 23.6% |
| Sudanese | 27.8 /100 | #194 | Fair 23.7% |
| Immigrants | St. Vincent and the Grenadines | 26.1 /100 | #195 | Fair 23.7% |
| Immigrants | Trinidad and Tobago | 26.1 /100 | #196 | Fair 23.7% |
| Immigrants | Immigrants | 25.8 /100 | #197 | Fair 23.7% |
| Immigrants | Africa | 24.4 /100 | #198 | Fair 23.7% |
| Welsh | 24.3 /100 | #199 | Fair 23.7% |
| French Canadians | 24.0 /100 | #200 | Fair 23.7% |
| Immigrants | Ecuador | 23.9 /100 | #201 | Fair 23.7% |
| Immigrants | Bahamas | 23.3 /100 | #202 | Fair 23.7% |
| Kenyans | 23.2 /100 | #203 | Fair 23.7% |