Immigrants from Ethiopia vs Immigrants from the Azores Vision Disability
COMPARE
Immigrants from Ethiopia
Immigrants from the Azores
Vision Disability
Vision Disability Comparison
Immigrants from Ethiopia
Immigrants from the Azores
2.0%
VISION DISABILITY
99.7/ 100
METRIC RATING
42nd/ 347
METRIC RANK
2.4%
VISION DISABILITY
0.1/ 100
METRIC RATING
271st/ 347
METRIC RANK
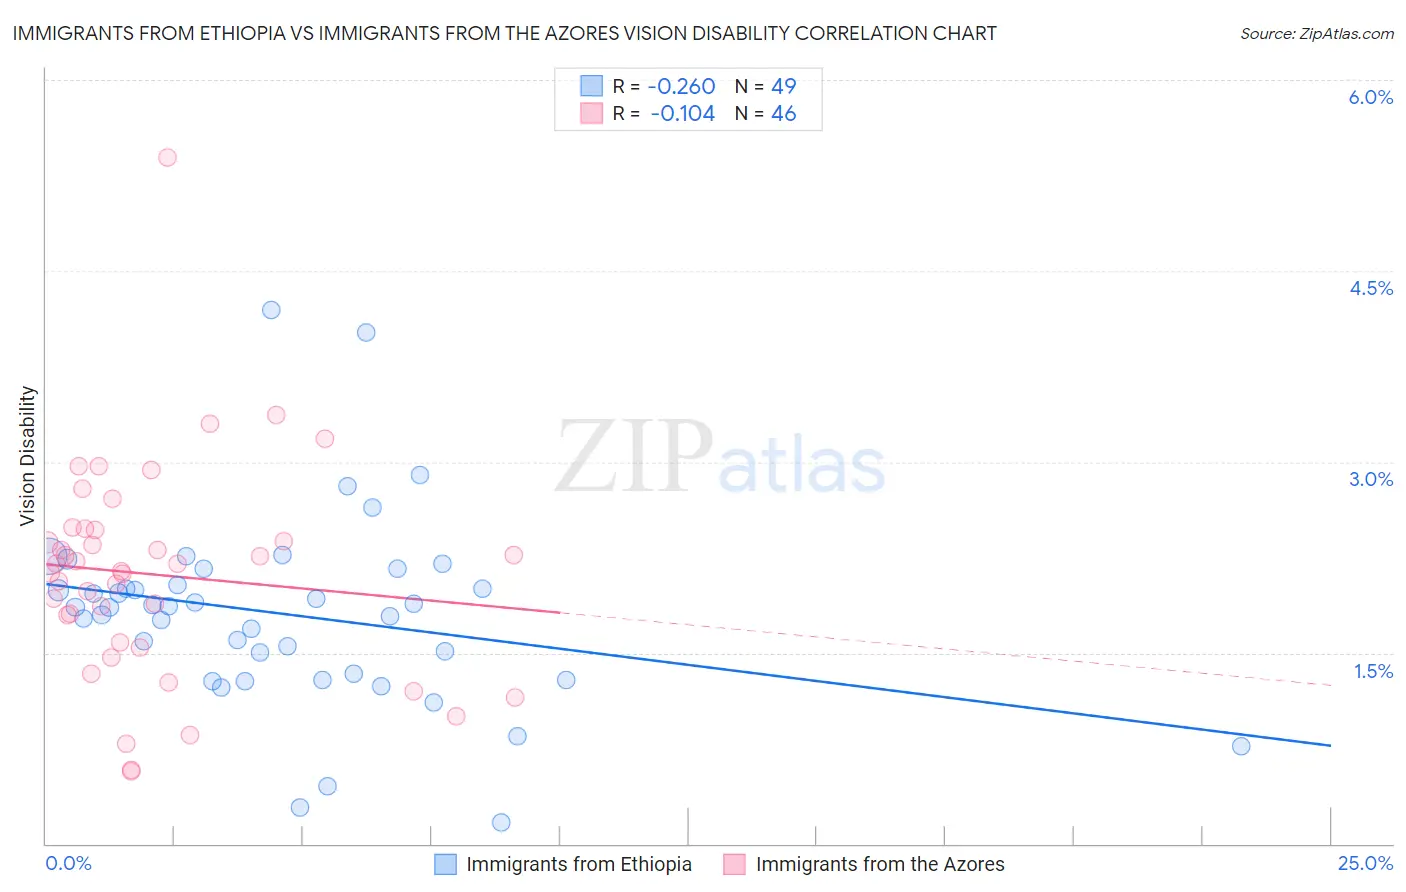
Immigrants from Ethiopia vs Immigrants from the Azores Vision Disability Correlation Chart
The statistical analysis conducted on geographies consisting of 211,444,224 people shows a weak negative correlation between the proportion of Immigrants from Ethiopia and percentage of population with vision disability in the United States with a correlation coefficient (R) of -0.260 and weighted average of 2.0%. Similarly, the statistical analysis conducted on geographies consisting of 46,255,686 people shows a poor negative correlation between the proportion of Immigrants from the Azores and percentage of population with vision disability in the United States with a correlation coefficient (R) of -0.104 and weighted average of 2.4%, a difference of 22.5%.
Vision Disability Correlation Summary
| Measurement | Immigrants from Ethiopia | Immigrants from the Azores |
| Minimum | 0.17% | 0.57% |
| Maximum | 4.2% | 5.4% |
| Range | 4.0% | 4.8% |
| Mean | 1.8% | 2.1% |
| Median | 1.9% | 2.2% |
| Interquartile 25% (IQ1) | 1.3% | 1.6% |
| Interquartile 75% (IQ3) | 2.1% | 2.5% |
| Interquartile Range (IQR) | 0.79% | 0.89% |
| Standard Deviation (Sample) | 0.74% | 0.85% |
| Standard Deviation (Population) | 0.74% | 0.84% |
Similar Demographics by Vision Disability
Demographics Similar to Immigrants from Ethiopia by Vision Disability
In terms of vision disability, the demographic groups most similar to Immigrants from Ethiopia are Eastern European (2.0%, a difference of 0.060%), Immigrants from Indonesia (2.0%, a difference of 0.090%), Ethiopian (2.0%, a difference of 0.11%), Immigrants from Sweden (2.0%, a difference of 0.15%), and Cypriot (2.0%, a difference of 0.16%).
| Demographics | Rating | Rank | Vision Disability |
| Immigrants | Australia | 99.8 /100 | #35 | Exceptional 1.9% |
| Cambodians | 99.8 /100 | #36 | Exceptional 2.0% |
| Bhutanese | 99.8 /100 | #37 | Exceptional 2.0% |
| Immigrants | Kuwait | 99.8 /100 | #38 | Exceptional 2.0% |
| Zimbabweans | 99.7 /100 | #39 | Exceptional 2.0% |
| Immigrants | Ireland | 99.7 /100 | #40 | Exceptional 2.0% |
| Cypriots | 99.7 /100 | #41 | Exceptional 2.0% |
| Immigrants | Ethiopia | 99.7 /100 | #42 | Exceptional 2.0% |
| Eastern Europeans | 99.7 /100 | #43 | Exceptional 2.0% |
| Immigrants | Indonesia | 99.7 /100 | #44 | Exceptional 2.0% |
| Ethiopians | 99.7 /100 | #45 | Exceptional 2.0% |
| Immigrants | Sweden | 99.7 /100 | #46 | Exceptional 2.0% |
| Immigrants | Bulgaria | 99.7 /100 | #47 | Exceptional 2.0% |
| Israelis | 99.6 /100 | #48 | Exceptional 2.0% |
| Latvians | 99.5 /100 | #49 | Exceptional 2.0% |
Demographics Similar to Immigrants from the Azores by Vision Disability
In terms of vision disability, the demographic groups most similar to Immigrants from the Azores are Spaniard (2.4%, a difference of 0.10%), Celtic (2.4%, a difference of 0.16%), Cuban (2.4%, a difference of 0.16%), Immigrants from Bahamas (2.4%, a difference of 0.43%), and Senegalese (2.4%, a difference of 0.44%).
| Demographics | Rating | Rank | Vision Disability |
| Immigrants | Liberia | 0.1 /100 | #264 | Tragic 2.4% |
| Immigrants | Jamaica | 0.1 /100 | #265 | Tragic 2.4% |
| Mexican American Indians | 0.1 /100 | #266 | Tragic 2.4% |
| Ute | 0.1 /100 | #267 | Tragic 2.4% |
| Senegalese | 0.1 /100 | #268 | Tragic 2.4% |
| Celtics | 0.1 /100 | #269 | Tragic 2.4% |
| Cubans | 0.1 /100 | #270 | Tragic 2.4% |
| Immigrants | Azores | 0.1 /100 | #271 | Tragic 2.4% |
| Spaniards | 0.1 /100 | #272 | Tragic 2.4% |
| Immigrants | Bahamas | 0.1 /100 | #273 | Tragic 2.4% |
| Immigrants | Latin America | 0.0 /100 | #274 | Tragic 2.4% |
| Chippewa | 0.0 /100 | #275 | Tragic 2.4% |
| Scotch-Irish | 0.0 /100 | #276 | Tragic 2.4% |
| Bahamians | 0.0 /100 | #277 | Tragic 2.4% |
| Spanish | 0.0 /100 | #278 | Tragic 2.4% |