Immigrants from England vs Yugoslavian Disability Age 18 to 34
COMPARE
Immigrants from England
Yugoslavian
Disability Age 18 to 34
Disability Age 18 to 34 Comparison
Immigrants from England
Yugoslavians
6.9%
DISABILITY AGE 18 TO 34
5.3/ 100
METRIC RATING
222nd/ 347
METRIC RANK
7.2%
DISABILITY AGE 18 TO 34
0.8/ 100
METRIC RATING
247th/ 347
METRIC RANK
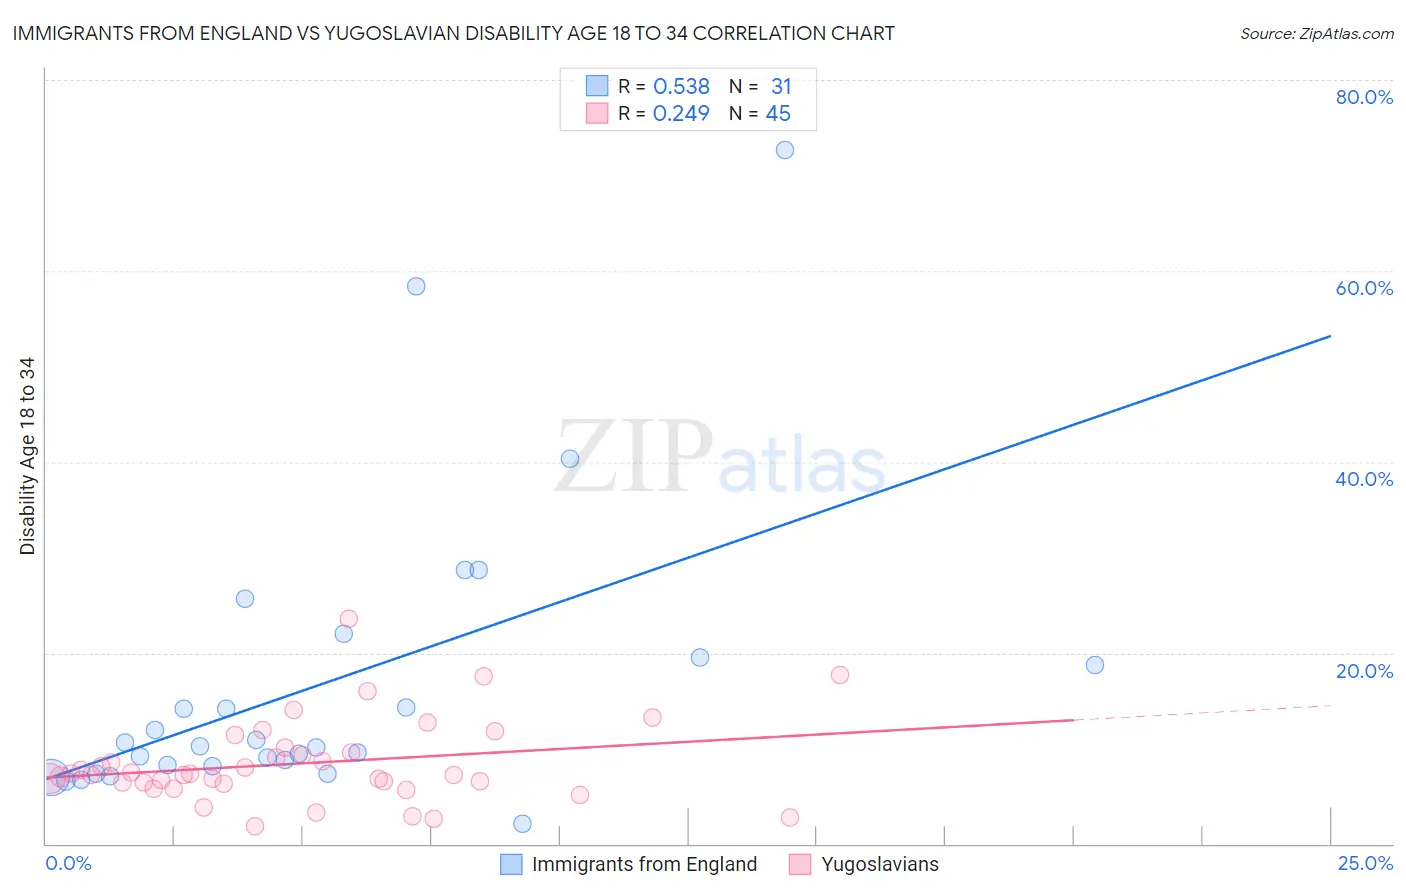
Immigrants from England vs Yugoslavian Disability Age 18 to 34 Correlation Chart
The statistical analysis conducted on geographies consisting of 390,726,381 people shows a substantial positive correlation between the proportion of Immigrants from England and percentage of population with a disability between the ages 18 and 35 in the United States with a correlation coefficient (R) of 0.538 and weighted average of 6.9%. Similarly, the statistical analysis conducted on geographies consisting of 285,257,895 people shows a weak positive correlation between the proportion of Yugoslavians and percentage of population with a disability between the ages 18 and 35 in the United States with a correlation coefficient (R) of 0.249 and weighted average of 7.2%, a difference of 3.3%.
Disability Age 18 to 34 Correlation Summary
| Measurement | Immigrants from England | Yugoslavian |
| Minimum | 2.1% | 1.9% |
| Maximum | 72.7% | 23.6% |
| Range | 70.6% | 21.8% |
| Mean | 16.7% | 8.4% |
| Median | 10.3% | 7.2% |
| Interquartile 25% (IQ1) | 8.1% | 6.3% |
| Interquartile 75% (IQ3) | 19.4% | 9.8% |
| Interquartile Range (IQR) | 11.3% | 3.5% |
| Standard Deviation (Sample) | 15.5% | 4.3% |
| Standard Deviation (Population) | 15.3% | 4.3% |
Similar Demographics by Disability Age 18 to 34
Demographics Similar to Immigrants from England by Disability Age 18 to 34
In terms of disability age 18 to 34, the demographic groups most similar to Immigrants from England are Carpatho Rusyn (6.9%, a difference of 0.030%), Immigrants from Middle Africa (6.9%, a difference of 0.070%), Immigrants from Senegal (6.9%, a difference of 0.080%), Senegalese (6.9%, a difference of 0.12%), and Central American Indian (6.9%, a difference of 0.20%).
| Demographics | Rating | Rank | Disability Age 18 to 34 |
| Immigrants | Thailand | 7.5 /100 | #215 | Tragic 6.9% |
| Sudanese | 7.0 /100 | #216 | Tragic 6.9% |
| Immigrants | Kenya | 6.9 /100 | #217 | Tragic 6.9% |
| Ukrainians | 6.7 /100 | #218 | Tragic 6.9% |
| Hawaiians | 6.5 /100 | #219 | Tragic 6.9% |
| Immigrants | Senegal | 5.5 /100 | #220 | Tragic 6.9% |
| Immigrants | Middle Africa | 5.5 /100 | #221 | Tragic 6.9% |
| Immigrants | England | 5.3 /100 | #222 | Tragic 6.9% |
| Carpatho Rusyns | 5.2 /100 | #223 | Tragic 6.9% |
| Senegalese | 4.9 /100 | #224 | Tragic 6.9% |
| Central American Indians | 4.7 /100 | #225 | Tragic 6.9% |
| Ugandans | 4.4 /100 | #226 | Tragic 6.9% |
| Immigrants | Canada | 4.3 /100 | #227 | Tragic 7.0% |
| Immigrants | Yemen | 4.2 /100 | #228 | Tragic 7.0% |
| Lithuanians | 4.1 /100 | #229 | Tragic 7.0% |
Demographics Similar to Yugoslavians by Disability Age 18 to 34
In terms of disability age 18 to 34, the demographic groups most similar to Yugoslavians are Guamanian/Chamorro (7.2%, a difference of 0.040%), Malaysian (7.2%, a difference of 0.13%), Immigrants from Liberia (7.1%, a difference of 0.15%), Hungarian (7.1%, a difference of 0.17%), and Immigrants from Zaire (7.1%, a difference of 0.27%).
| Demographics | Rating | Rank | Disability Age 18 to 34 |
| Arapaho | 1.1 /100 | #240 | Tragic 7.1% |
| Nepalese | 1.1 /100 | #241 | Tragic 7.1% |
| Immigrants | Congo | 1.1 /100 | #242 | Tragic 7.1% |
| Icelanders | 1.0 /100 | #243 | Tragic 7.1% |
| Immigrants | Zaire | 0.9 /100 | #244 | Tragic 7.1% |
| Hungarians | 0.9 /100 | #245 | Tragic 7.1% |
| Immigrants | Liberia | 0.8 /100 | #246 | Tragic 7.1% |
| Yugoslavians | 0.8 /100 | #247 | Tragic 7.2% |
| Guamanians/Chamorros | 0.8 /100 | #248 | Tragic 7.2% |
| Malaysians | 0.7 /100 | #249 | Tragic 7.2% |
| Fijians | 0.6 /100 | #250 | Tragic 7.2% |
| Spaniards | 0.6 /100 | #251 | Tragic 7.2% |
| Poles | 0.6 /100 | #252 | Tragic 7.2% |
| Croatians | 0.5 /100 | #253 | Tragic 7.2% |
| Indonesians | 0.4 /100 | #254 | Tragic 7.2% |