Immigrants from England vs Immigrants from Turkey Hearing Disability
COMPARE
Immigrants from England
Immigrants from Turkey
Hearing Disability
Hearing Disability Comparison
Immigrants from England
Immigrants from Turkey
3.3%
HEARING DISABILITY
0.7/ 100
METRIC RATING
246th/ 347
METRIC RANK
2.8%
HEARING DISABILITY
96.7/ 100
METRIC RATING
88th/ 347
METRIC RANK
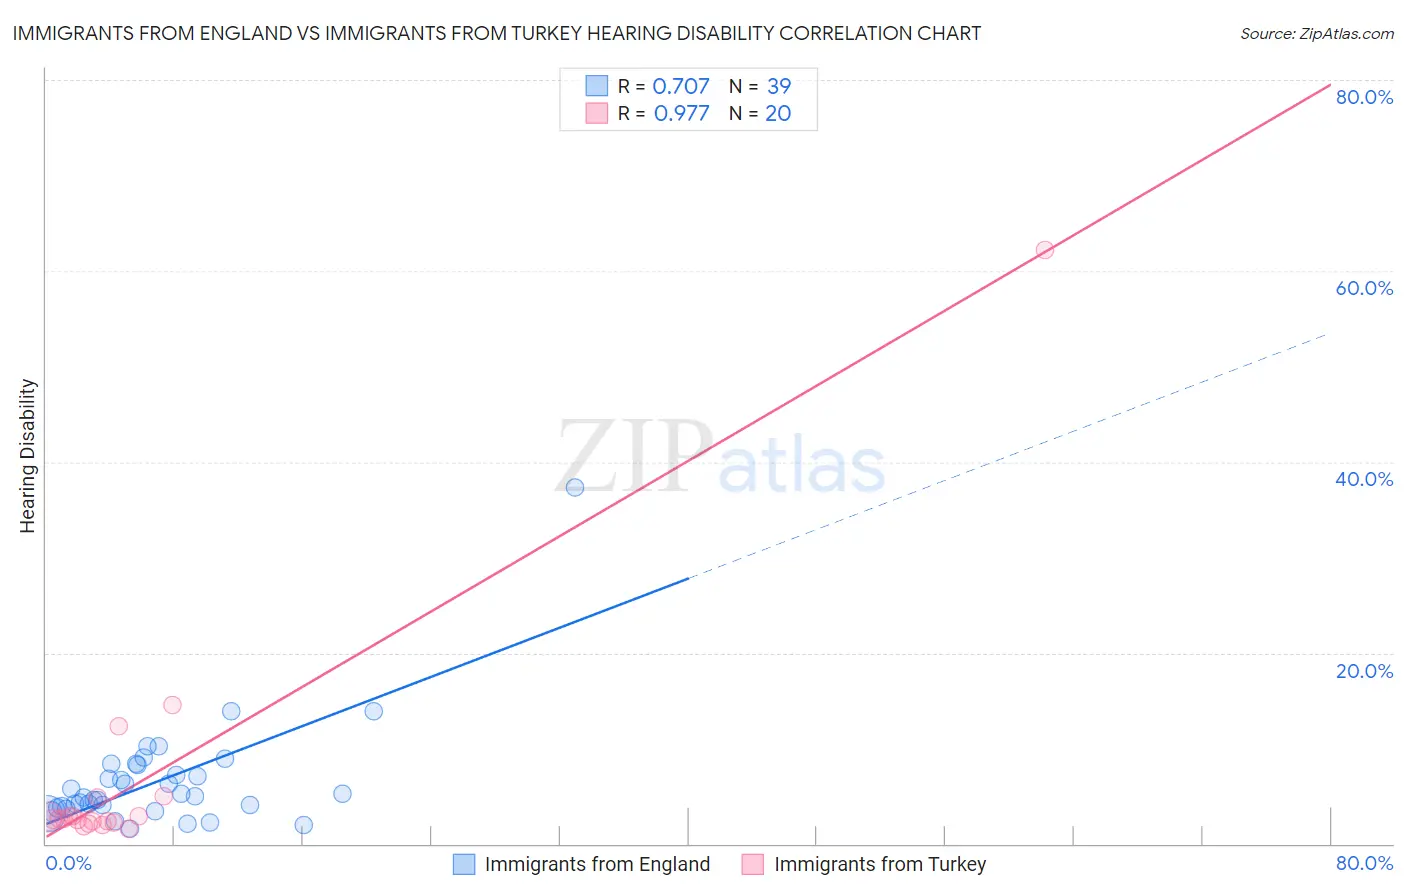
Immigrants from England vs Immigrants from Turkey Hearing Disability Correlation Chart
The statistical analysis conducted on geographies consisting of 391,804,752 people shows a strong positive correlation between the proportion of Immigrants from England and percentage of population with hearing disability in the United States with a correlation coefficient (R) of 0.707 and weighted average of 3.3%. Similarly, the statistical analysis conducted on geographies consisting of 223,029,530 people shows a perfect positive correlation between the proportion of Immigrants from Turkey and percentage of population with hearing disability in the United States with a correlation coefficient (R) of 0.977 and weighted average of 2.8%, a difference of 21.2%.
Hearing Disability Correlation Summary
| Measurement | Immigrants from England | Immigrants from Turkey |
| Minimum | 1.6% | 1.5% |
| Maximum | 37.3% | 62.2% |
| Range | 35.7% | 60.6% |
| Mean | 6.6% | 6.8% |
| Median | 5.0% | 2.7% |
| Interquartile 25% (IQ1) | 3.8% | 2.3% |
| Interquartile 75% (IQ3) | 8.3% | 3.9% |
| Interquartile Range (IQR) | 4.5% | 1.5% |
| Standard Deviation (Sample) | 5.9% | 13.5% |
| Standard Deviation (Population) | 5.8% | 13.1% |
Similar Demographics by Hearing Disability
Demographics Similar to Immigrants from England by Hearing Disability
In terms of hearing disability, the demographic groups most similar to Immigrants from England are Lithuanian (3.4%, a difference of 0.20%), Immigrants from Scotland (3.3%, a difference of 0.28%), Austrian (3.4%, a difference of 0.42%), Assyrian/Chaldean/Syriac (3.3%, a difference of 0.62%), and Immigrants from Western Europe (3.3%, a difference of 0.69%).
| Demographics | Rating | Rank | Hearing Disability |
| Nepalese | 1.2 /100 | #239 | Tragic 3.3% |
| Immigrants | Netherlands | 1.1 /100 | #240 | Tragic 3.3% |
| Samoans | 1.1 /100 | #241 | Tragic 3.3% |
| Yugoslavians | 1.0 /100 | #242 | Tragic 3.3% |
| Immigrants | Western Europe | 1.0 /100 | #243 | Tragic 3.3% |
| Assyrians/Chaldeans/Syriacs | 0.9 /100 | #244 | Tragic 3.3% |
| Immigrants | Scotland | 0.8 /100 | #245 | Tragic 3.3% |
| Immigrants | England | 0.7 /100 | #246 | Tragic 3.3% |
| Lithuanians | 0.6 /100 | #247 | Tragic 3.4% |
| Austrians | 0.6 /100 | #248 | Tragic 3.4% |
| Italians | 0.4 /100 | #249 | Tragic 3.4% |
| Yuman | 0.4 /100 | #250 | Tragic 3.4% |
| Hungarians | 0.4 /100 | #251 | Tragic 3.4% |
| Croatians | 0.4 /100 | #252 | Tragic 3.4% |
| Carpatho Rusyns | 0.3 /100 | #253 | Tragic 3.4% |
Demographics Similar to Immigrants from Turkey by Hearing Disability
In terms of hearing disability, the demographic groups most similar to Immigrants from Turkey are Belizean (2.8%, a difference of 0.030%), Somali (2.8%, a difference of 0.040%), Immigrants from Morocco (2.8%, a difference of 0.050%), Immigrants from Middle Africa (2.8%, a difference of 0.13%), and Immigrants from Iran (2.8%, a difference of 0.14%).
| Demographics | Rating | Rank | Hearing Disability |
| Immigrants | Uruguay | 97.2 /100 | #81 | Exceptional 2.7% |
| Immigrants | Armenia | 97.2 /100 | #82 | Exceptional 2.7% |
| Immigrants | Cuba | 97.2 /100 | #83 | Exceptional 2.7% |
| Immigrants | Argentina | 97.0 /100 | #84 | Exceptional 2.8% |
| Immigrants | Northern Africa | 96.9 /100 | #85 | Exceptional 2.8% |
| Immigrants | Iran | 96.8 /100 | #86 | Exceptional 2.8% |
| Somalis | 96.7 /100 | #87 | Exceptional 2.8% |
| Immigrants | Turkey | 96.7 /100 | #88 | Exceptional 2.8% |
| Belizeans | 96.6 /100 | #89 | Exceptional 2.8% |
| Immigrants | Morocco | 96.6 /100 | #90 | Exceptional 2.8% |
| Immigrants | Middle Africa | 96.5 /100 | #91 | Exceptional 2.8% |
| Iranians | 96.4 /100 | #92 | Exceptional 2.8% |
| Immigrants | Kuwait | 96.3 /100 | #93 | Exceptional 2.8% |
| Uruguayans | 95.9 /100 | #94 | Exceptional 2.8% |
| Israelis | 95.9 /100 | #95 | Exceptional 2.8% |