Immigrants from England vs Hopi Disability Age 65 to 74
COMPARE
Immigrants from England
Hopi
Disability Age 65 to 74
Disability Age 65 to 74 Comparison
Immigrants from England
Hopi
22.2%
DISABILITY AGE 65 TO 74
96.5/ 100
METRIC RATING
101st/ 347
METRIC RANK
30.0%
DISABILITY AGE 65 TO 74
0.0/ 100
METRIC RATING
328th/ 347
METRIC RANK
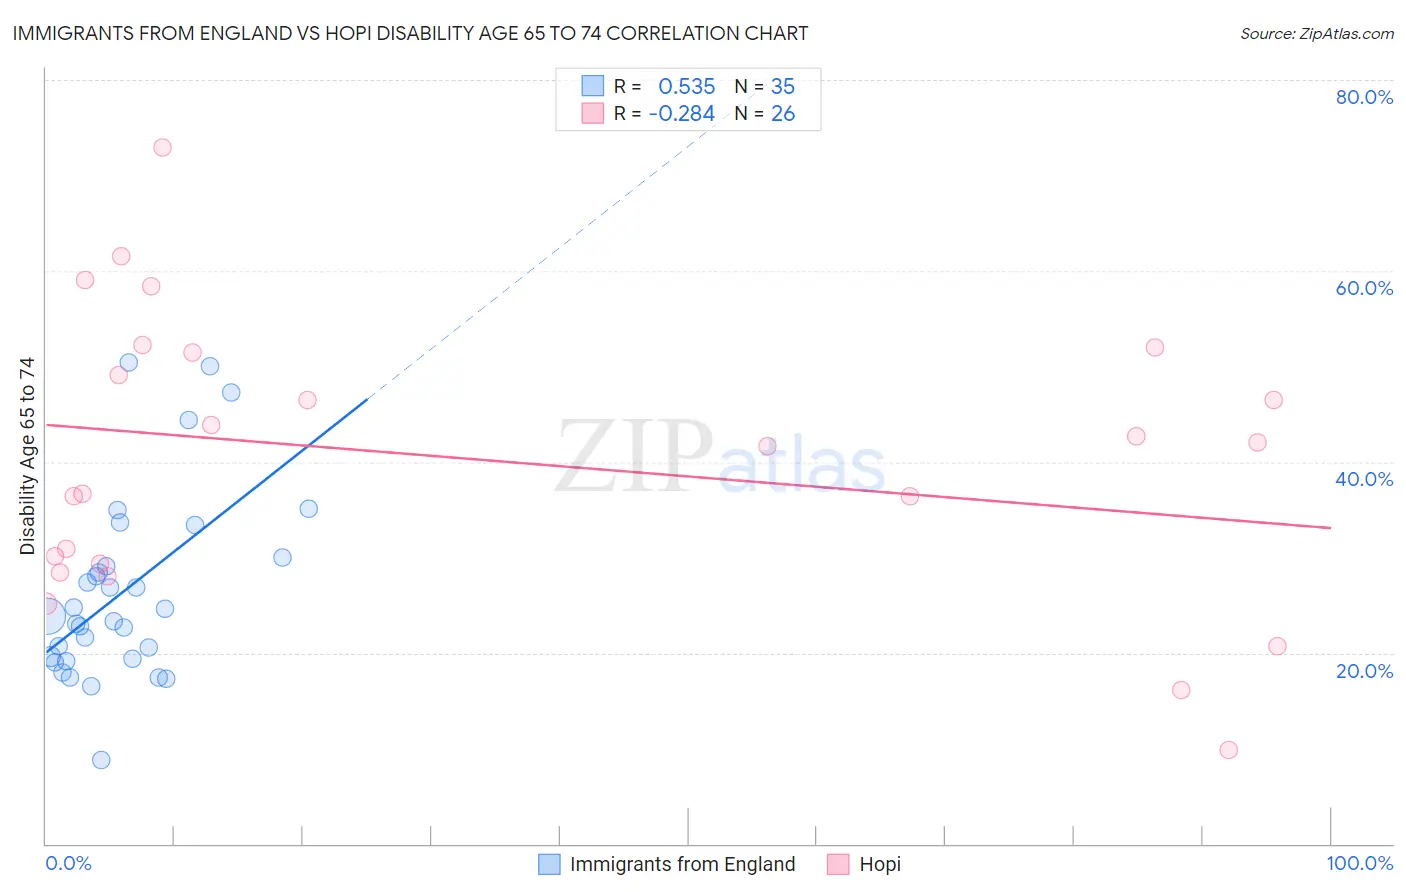
Immigrants from England vs Hopi Disability Age 65 to 74 Correlation Chart
The statistical analysis conducted on geographies consisting of 391,407,764 people shows a substantial positive correlation between the proportion of Immigrants from England and percentage of population with a disability between the ages 65 and 75 in the United States with a correlation coefficient (R) of 0.535 and weighted average of 22.2%. Similarly, the statistical analysis conducted on geographies consisting of 74,641,901 people shows a weak negative correlation between the proportion of Hopi and percentage of population with a disability between the ages 65 and 75 in the United States with a correlation coefficient (R) of -0.284 and weighted average of 30.0%, a difference of 34.8%.
Disability Age 65 to 74 Correlation Summary
| Measurement | Immigrants from England | Hopi |
| Minimum | 8.8% | 9.9% |
| Maximum | 50.5% | 72.9% |
| Range | 41.7% | 63.1% |
| Mean | 26.5% | 40.3% |
| Median | 23.9% | 41.8% |
| Interquartile 25% (IQ1) | 19.4% | 29.4% |
| Interquartile 75% (IQ3) | 30.0% | 51.5% |
| Interquartile Range (IQR) | 10.6% | 22.1% |
| Standard Deviation (Sample) | 9.8% | 14.9% |
| Standard Deviation (Population) | 9.6% | 14.6% |
Similar Demographics by Disability Age 65 to 74
Demographics Similar to Immigrants from England by Disability Age 65 to 74
In terms of disability age 65 to 74, the demographic groups most similar to Immigrants from England are Uruguayan (22.2%, a difference of 0.020%), Immigrants from Saudi Arabia (22.2%, a difference of 0.020%), South American (22.2%, a difference of 0.050%), Colombian (22.2%, a difference of 0.060%), and Palestinian (22.2%, a difference of 0.10%).
| Demographics | Rating | Rank | Disability Age 65 to 74 |
| Immigrants | Chile | 97.7 /100 | #94 | Exceptional 22.1% |
| Romanians | 97.7 /100 | #95 | Exceptional 22.1% |
| Immigrants | North America | 97.5 /100 | #96 | Exceptional 22.1% |
| Immigrants | Southern Europe | 97.2 /100 | #97 | Exceptional 22.1% |
| Jordanians | 96.9 /100 | #98 | Exceptional 22.2% |
| Immigrants | Colombia | 96.8 /100 | #99 | Exceptional 22.2% |
| Uruguayans | 96.5 /100 | #100 | Exceptional 22.2% |
| Immigrants | England | 96.5 /100 | #101 | Exceptional 22.2% |
| Immigrants | Saudi Arabia | 96.4 /100 | #102 | Exceptional 22.2% |
| South Americans | 96.4 /100 | #103 | Exceptional 22.2% |
| Colombians | 96.4 /100 | #104 | Exceptional 22.2% |
| Palestinians | 96.3 /100 | #105 | Exceptional 22.2% |
| Peruvians | 96.1 /100 | #106 | Exceptional 22.2% |
| Slovenes | 96.1 /100 | #107 | Exceptional 22.2% |
| Immigrants | Zimbabwe | 96.1 /100 | #108 | Exceptional 22.3% |
Demographics Similar to Hopi by Disability Age 65 to 74
In terms of disability age 65 to 74, the demographic groups most similar to Hopi are Choctaw (30.2%, a difference of 0.80%), Creek (30.2%, a difference of 0.83%), Chickasaw (30.2%, a difference of 0.84%), Apache (29.7%, a difference of 0.94%), and Yakama (29.6%, a difference of 1.1%).
| Demographics | Rating | Rank | Disability Age 65 to 74 |
| Comanche | 0.0 /100 | #321 | Tragic 28.3% |
| Aleuts | 0.0 /100 | #322 | Tragic 28.4% |
| Puerto Ricans | 0.0 /100 | #323 | Tragic 29.1% |
| Seminole | 0.0 /100 | #324 | Tragic 29.4% |
| Dutch West Indians | 0.0 /100 | #325 | Tragic 29.6% |
| Yakama | 0.0 /100 | #326 | Tragic 29.6% |
| Apache | 0.0 /100 | #327 | Tragic 29.7% |
| Hopi | 0.0 /100 | #328 | Tragic 30.0% |
| Choctaw | 0.0 /100 | #329 | Tragic 30.2% |
| Creek | 0.0 /100 | #330 | Tragic 30.2% |
| Chickasaw | 0.0 /100 | #331 | Tragic 30.2% |
| Natives/Alaskans | 0.0 /100 | #332 | Tragic 30.4% |
| Colville | 0.0 /100 | #333 | Tragic 30.5% |
| Alaska Natives | 0.0 /100 | #334 | Tragic 30.6% |
| Cheyenne | 0.0 /100 | #335 | Tragic 31.1% |