Immigrants from England vs Filipino Cognitive Disability
COMPARE
Immigrants from England
Filipino
Cognitive Disability
Cognitive Disability Comparison
Immigrants from England
Filipinos
16.6%
COGNITIVE DISABILITY
99.6/ 100
METRIC RATING
61st/ 347
METRIC RANK
16.4%
COGNITIVE DISABILITY
99.9/ 100
METRIC RATING
29th/ 347
METRIC RANK
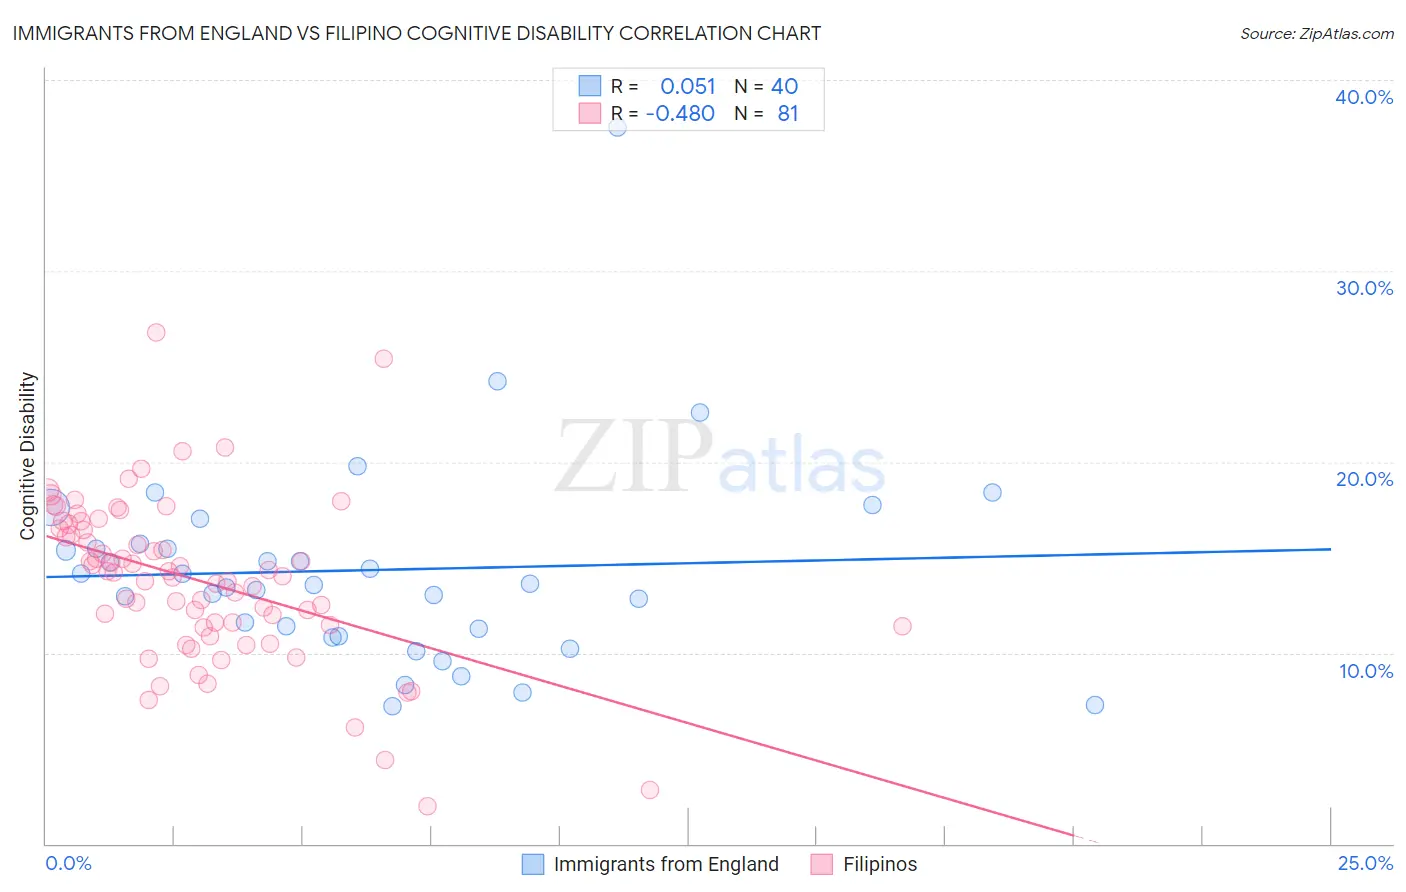
Immigrants from England vs Filipino Cognitive Disability Correlation Chart
The statistical analysis conducted on geographies consisting of 391,893,945 people shows a slight positive correlation between the proportion of Immigrants from England and percentage of population with cognitive disability in the United States with a correlation coefficient (R) of 0.051 and weighted average of 16.6%. Similarly, the statistical analysis conducted on geographies consisting of 254,348,780 people shows a moderate negative correlation between the proportion of Filipinos and percentage of population with cognitive disability in the United States with a correlation coefficient (R) of -0.480 and weighted average of 16.4%, a difference of 1.2%.
Cognitive Disability Correlation Summary
| Measurement | Immigrants from England | Filipino |
| Minimum | 7.2% | 2.0% |
| Maximum | 37.5% | 26.8% |
| Range | 30.3% | 24.8% |
| Mean | 14.3% | 13.8% |
| Median | 13.6% | 14.2% |
| Interquartile 25% (IQ1) | 11.1% | 11.4% |
| Interquartile 75% (IQ3) | 15.6% | 16.6% |
| Interquartile Range (IQR) | 4.5% | 5.2% |
| Standard Deviation (Sample) | 5.4% | 4.3% |
| Standard Deviation (Population) | 5.3% | 4.2% |
Similar Demographics by Cognitive Disability
Demographics Similar to Immigrants from England by Cognitive Disability
In terms of cognitive disability, the demographic groups most similar to Immigrants from England are Czechoslovakian (16.6%, a difference of 0.030%), Argentinean (16.6%, a difference of 0.050%), Romanian (16.6%, a difference of 0.060%), Pennsylvania German (16.6%, a difference of 0.070%), and Immigrants from Peru (16.6%, a difference of 0.070%).
| Demographics | Rating | Rank | Cognitive Disability |
| Immigrants | Iran | 99.8 /100 | #54 | Exceptional 16.5% |
| Immigrants | Venezuela | 99.7 /100 | #55 | Exceptional 16.5% |
| Austrians | 99.7 /100 | #56 | Exceptional 16.6% |
| Bhutanese | 99.7 /100 | #57 | Exceptional 16.6% |
| Pennsylvania Germans | 99.7 /100 | #58 | Exceptional 16.6% |
| Immigrants | Peru | 99.7 /100 | #59 | Exceptional 16.6% |
| Romanians | 99.7 /100 | #60 | Exceptional 16.6% |
| Immigrants | England | 99.6 /100 | #61 | Exceptional 16.6% |
| Czechoslovakians | 99.6 /100 | #62 | Exceptional 16.6% |
| Argentineans | 99.6 /100 | #63 | Exceptional 16.6% |
| Venezuelans | 99.6 /100 | #64 | Exceptional 16.6% |
| Colombians | 99.6 /100 | #65 | Exceptional 16.6% |
| Immigrants | Ukraine | 99.5 /100 | #66 | Exceptional 16.6% |
| Latvians | 99.5 /100 | #67 | Exceptional 16.6% |
| Ukrainians | 99.4 /100 | #68 | Exceptional 16.6% |
Demographics Similar to Filipinos by Cognitive Disability
In terms of cognitive disability, the demographic groups most similar to Filipinos are Czech (16.4%, a difference of 0.0%), Immigrants from Romania (16.4%, a difference of 0.020%), Immigrants from Pakistan (16.4%, a difference of 0.030%), Polish (16.4%, a difference of 0.030%), and Immigrants from Croatia (16.4%, a difference of 0.050%).
| Demographics | Rating | Rank | Cognitive Disability |
| Immigrants | South Central Asia | 99.9 /100 | #22 | Exceptional 16.4% |
| Croatians | 99.9 /100 | #23 | Exceptional 16.4% |
| Immigrants | Argentina | 99.9 /100 | #24 | Exceptional 16.4% |
| Luxembourgers | 99.9 /100 | #25 | Exceptional 16.4% |
| Immigrants | Croatia | 99.9 /100 | #26 | Exceptional 16.4% |
| Immigrants | Pakistan | 99.9 /100 | #27 | Exceptional 16.4% |
| Poles | 99.9 /100 | #28 | Exceptional 16.4% |
| Filipinos | 99.9 /100 | #29 | Exceptional 16.4% |
| Czechs | 99.9 /100 | #30 | Exceptional 16.4% |
| Immigrants | Romania | 99.9 /100 | #31 | Exceptional 16.4% |
| Immigrants | Israel | 99.9 /100 | #32 | Exceptional 16.4% |
| Italians | 99.9 /100 | #33 | Exceptional 16.4% |
| Russians | 99.9 /100 | #34 | Exceptional 16.4% |
| Slovaks | 99.9 /100 | #35 | Exceptional 16.4% |
| Greeks | 99.9 /100 | #36 | Exceptional 16.4% |