Immigrants from Eastern Africa vs Immigrants from Asia Ambulatory Disability
COMPARE
Immigrants from Eastern Africa
Immigrants from Asia
Ambulatory Disability
Ambulatory Disability Comparison
Immigrants from Eastern Africa
Immigrants from Asia
5.6%
AMBULATORY DISABILITY
99.8/ 100
METRIC RATING
54th/ 347
METRIC RANK
5.5%
AMBULATORY DISABILITY
100.0/ 100
METRIC RATING
34th/ 347
METRIC RANK
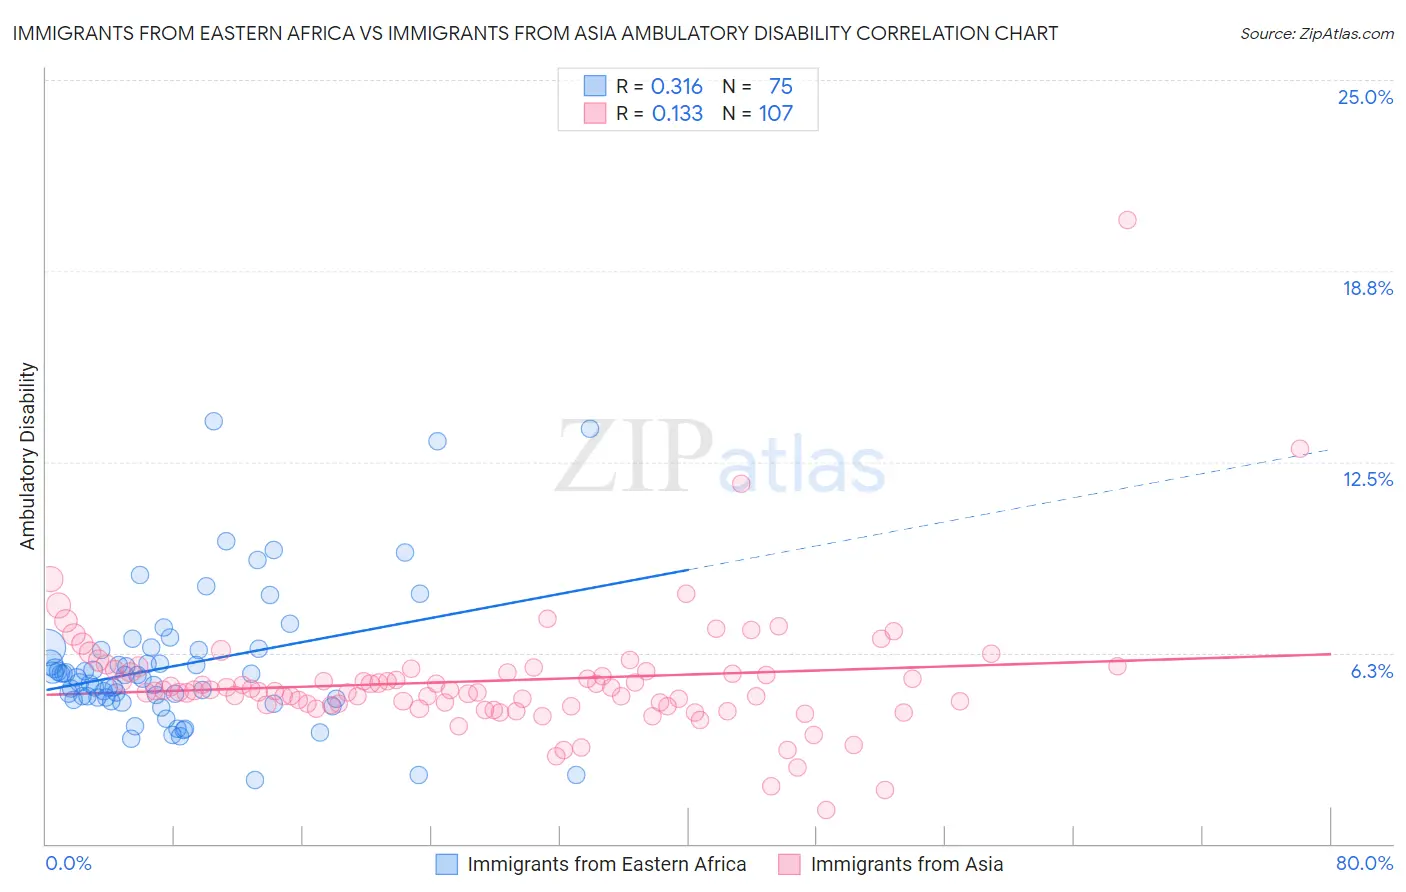
Immigrants from Eastern Africa vs Immigrants from Asia Ambulatory Disability Correlation Chart
The statistical analysis conducted on geographies consisting of 355,025,576 people shows a mild positive correlation between the proportion of Immigrants from Eastern Africa and percentage of population with ambulatory disability in the United States with a correlation coefficient (R) of 0.316 and weighted average of 5.6%. Similarly, the statistical analysis conducted on geographies consisting of 548,709,972 people shows a poor positive correlation between the proportion of Immigrants from Asia and percentage of population with ambulatory disability in the United States with a correlation coefficient (R) of 0.133 and weighted average of 5.5%, a difference of 2.4%.
Ambulatory Disability Correlation Summary
| Measurement | Immigrants from Eastern Africa | Immigrants from Asia |
| Minimum | 2.1% | 1.1% |
| Maximum | 13.8% | 20.4% |
| Range | 11.8% | 19.3% |
| Mean | 5.8% | 5.3% |
| Median | 5.5% | 5.0% |
| Interquartile 25% (IQ1) | 4.7% | 4.5% |
| Interquartile 75% (IQ3) | 6.4% | 5.6% |
| Interquartile Range (IQR) | 1.6% | 1.1% |
| Standard Deviation (Sample) | 2.2% | 2.1% |
| Standard Deviation (Population) | 2.2% | 2.1% |
Demographics Similar to Immigrants from Eastern Africa and Immigrants from Asia by Ambulatory Disability
In terms of ambulatory disability, the demographic groups most similar to Immigrants from Eastern Africa are Immigrants from Egypt (5.6%, a difference of 0.050%), Jordanian (5.6%, a difference of 0.060%), Taiwanese (5.6%, a difference of 0.15%), Luxembourger (5.6%, a difference of 0.25%), and Bulgarian (5.6%, a difference of 0.59%). Similarly, the demographic groups most similar to Immigrants from Asia are Afghan (5.5%, a difference of 0.040%), Immigrants from Malaysia (5.5%, a difference of 0.11%), Turkish (5.5%, a difference of 0.13%), Cypriot (5.5%, a difference of 0.13%), and Immigrants from Eritrea (5.5%, a difference of 0.22%).
| Demographics | Rating | Rank | Ambulatory Disability |
| Immigrants | Asia | 100.0 /100 | #34 | Exceptional 5.5% |
| Afghans | 100.0 /100 | #35 | Exceptional 5.5% |
| Immigrants | Malaysia | 100.0 /100 | #36 | Exceptional 5.5% |
| Turks | 100.0 /100 | #37 | Exceptional 5.5% |
| Cypriots | 100.0 /100 | #38 | Exceptional 5.5% |
| Immigrants | Eritrea | 100.0 /100 | #39 | Exceptional 5.5% |
| Venezuelans | 99.9 /100 | #40 | Exceptional 5.5% |
| Mongolians | 99.9 /100 | #41 | Exceptional 5.5% |
| Argentineans | 99.9 /100 | #42 | Exceptional 5.5% |
| Paraguayans | 99.9 /100 | #43 | Exceptional 5.5% |
| Immigrants | Indonesia | 99.9 /100 | #44 | Exceptional 5.5% |
| Immigrants | Sweden | 99.9 /100 | #45 | Exceptional 5.6% |
| Egyptians | 99.9 /100 | #46 | Exceptional 5.6% |
| Immigrants | Japan | 99.9 /100 | #47 | Exceptional 5.6% |
| Immigrants | Argentina | 99.9 /100 | #48 | Exceptional 5.6% |
| Bulgarians | 99.9 /100 | #49 | Exceptional 5.6% |
| Luxembourgers | 99.9 /100 | #50 | Exceptional 5.6% |
| Taiwanese | 99.8 /100 | #51 | Exceptional 5.6% |
| Jordanians | 99.8 /100 | #52 | Exceptional 5.6% |
| Immigrants | Egypt | 99.8 /100 | #53 | Exceptional 5.6% |
| Immigrants | Eastern Africa | 99.8 /100 | #54 | Exceptional 5.6% |