Immigrants from Eastern Africa vs Alaskan Athabascan Disability Age Over 75
COMPARE
Immigrants from Eastern Africa
Alaskan Athabascan
Disability Age Over 75
Disability Age Over 75 Comparison
Immigrants from Eastern Africa
Alaskan Athabascans
47.2%
DISABILITY AGE OVER 75
65.5/ 100
METRIC RATING
163rd/ 347
METRIC RANK
54.0%
DISABILITY AGE OVER 75
0.0/ 100
METRIC RATING
334th/ 347
METRIC RANK
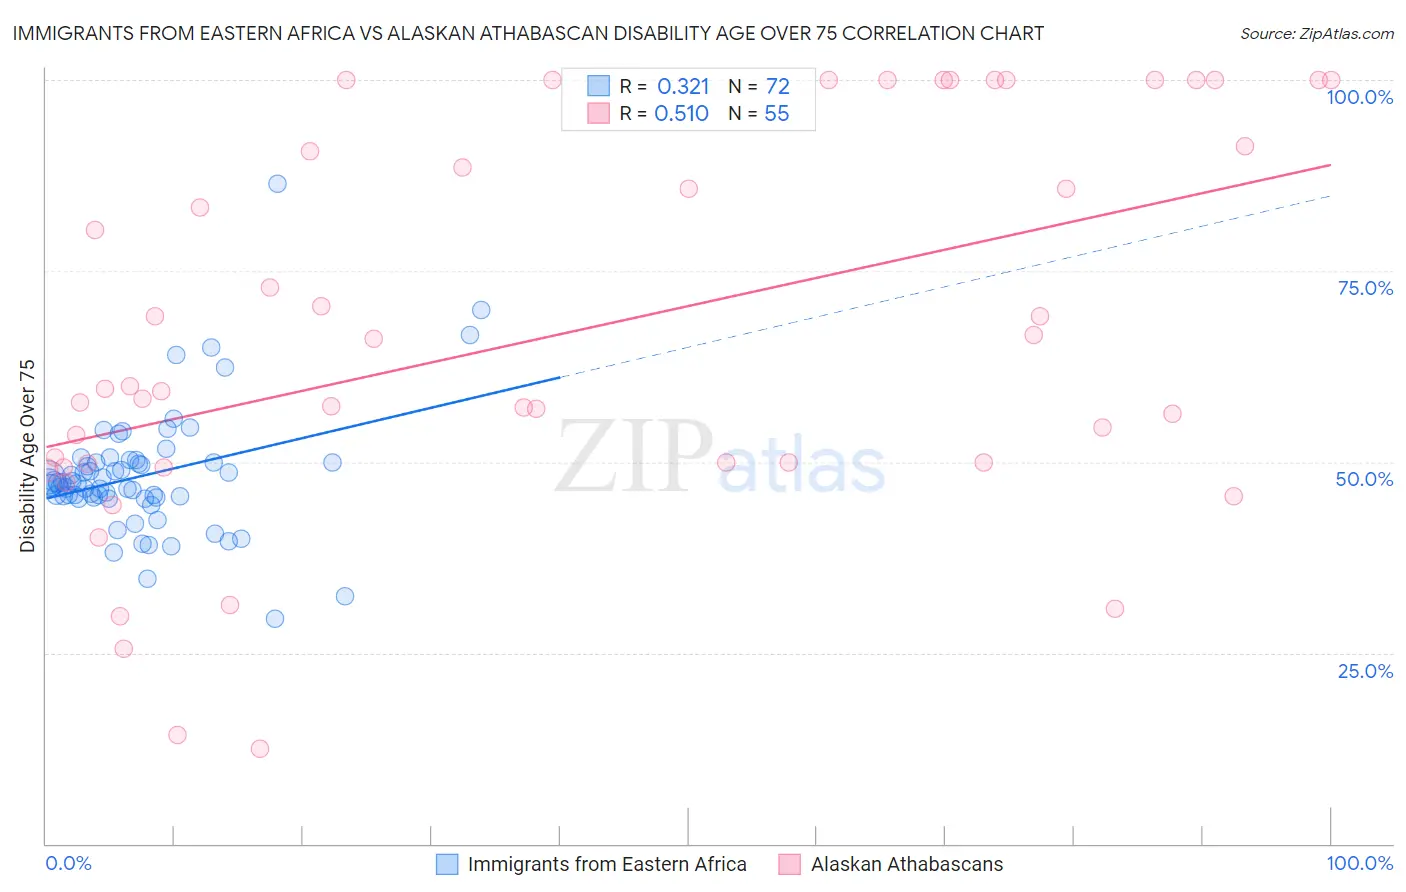
Immigrants from Eastern Africa vs Alaskan Athabascan Disability Age Over 75 Correlation Chart
The statistical analysis conducted on geographies consisting of 354,505,709 people shows a mild positive correlation between the proportion of Immigrants from Eastern Africa and percentage of population with a disability over the age of 75 in the United States with a correlation coefficient (R) of 0.321 and weighted average of 47.2%. Similarly, the statistical analysis conducted on geographies consisting of 45,799,271 people shows a substantial positive correlation between the proportion of Alaskan Athabascans and percentage of population with a disability over the age of 75 in the United States with a correlation coefficient (R) of 0.510 and weighted average of 54.0%, a difference of 14.4%.
Disability Age Over 75 Correlation Summary
| Measurement | Immigrants from Eastern Africa | Alaskan Athabascan |
| Minimum | 29.5% | 12.5% |
| Maximum | 86.5% | 100.0% |
| Range | 57.0% | 87.5% |
| Mean | 48.2% | 66.7% |
| Median | 47.2% | 59.6% |
| Interquartile 25% (IQ1) | 45.3% | 49.8% |
| Interquartile 75% (IQ3) | 50.0% | 91.3% |
| Interquartile Range (IQR) | 4.7% | 41.5% |
| Standard Deviation (Sample) | 8.3% | 25.1% |
| Standard Deviation (Population) | 8.2% | 24.8% |
Similar Demographics by Disability Age Over 75
Demographics Similar to Immigrants from Eastern Africa by Disability Age Over 75
In terms of disability age over 75, the demographic groups most similar to Immigrants from Eastern Africa are Pennsylvania German (47.2%, a difference of 0.010%), French (47.2%, a difference of 0.020%), Immigrants from Zimbabwe (47.2%, a difference of 0.030%), Immigrants from Sierra Leone (47.2%, a difference of 0.030%), and Immigrants from Middle Africa (47.1%, a difference of 0.070%).
| Demographics | Rating | Rank | Disability Age Over 75 |
| Arabs | 73.3 /100 | #156 | Good 47.1% |
| Bhutanese | 72.6 /100 | #157 | Good 47.1% |
| Immigrants | Guyana | 71.9 /100 | #158 | Good 47.1% |
| Immigrants | Morocco | 71.4 /100 | #159 | Good 47.1% |
| Immigrants | Middle Africa | 68.3 /100 | #160 | Good 47.1% |
| South American Indians | 68.1 /100 | #161 | Good 47.1% |
| Pennsylvania Germans | 66.0 /100 | #162 | Good 47.2% |
| Immigrants | Eastern Africa | 65.5 /100 | #163 | Good 47.2% |
| French | 64.6 /100 | #164 | Good 47.2% |
| Immigrants | Zimbabwe | 64.4 /100 | #165 | Good 47.2% |
| Immigrants | Sierra Leone | 64.4 /100 | #166 | Good 47.2% |
| Moroccans | 62.9 /100 | #167 | Good 47.2% |
| Kenyans | 58.8 /100 | #168 | Average 47.2% |
| Celtics | 58.7 /100 | #169 | Average 47.2% |
| German Russians | 56.2 /100 | #170 | Average 47.3% |
Demographics Similar to Alaskan Athabascans by Disability Age Over 75
In terms of disability age over 75, the demographic groups most similar to Alaskan Athabascans are Kiowa (54.2%, a difference of 0.53%), Apache (53.6%, a difference of 0.67%), Immigrants from Armenia (54.3%, a difference of 0.69%), Yuman (54.4%, a difference of 0.85%), and Native/Alaskan (53.1%, a difference of 1.7%).
| Demographics | Rating | Rank | Disability Age Over 75 |
| Nepalese | 0.0 /100 | #327 | Tragic 52.6% |
| Choctaw | 0.0 /100 | #328 | Tragic 52.7% |
| Alaska Natives | 0.0 /100 | #329 | Tragic 52.8% |
| Puerto Ricans | 0.0 /100 | #330 | Tragic 52.9% |
| Hopi | 0.0 /100 | #331 | Tragic 52.9% |
| Natives/Alaskans | 0.0 /100 | #332 | Tragic 53.1% |
| Apache | 0.0 /100 | #333 | Tragic 53.6% |
| Alaskan Athabascans | 0.0 /100 | #334 | Tragic 54.0% |
| Kiowa | 0.0 /100 | #335 | Tragic 54.2% |
| Immigrants | Armenia | 0.0 /100 | #336 | Tragic 54.3% |
| Yuman | 0.0 /100 | #337 | Tragic 54.4% |
| Colville | 0.0 /100 | #338 | Tragic 55.4% |
| Pima | 0.0 /100 | #339 | Tragic 55.8% |
| Pueblo | 0.0 /100 | #340 | Tragic 55.9% |
| Houma | 0.0 /100 | #341 | Tragic 56.2% |