Immigrants from Dominican Republic vs Cajun Ambulatory Disability
COMPARE
Immigrants from Dominican Republic
Cajun
Ambulatory Disability
Ambulatory Disability Comparison
Immigrants from Dominican Republic
Cajuns
7.1%
AMBULATORY DISABILITY
0.0/ 100
METRIC RATING
316th/ 347
METRIC RANK
7.8%
AMBULATORY DISABILITY
0.0/ 100
METRIC RATING
331st/ 347
METRIC RANK
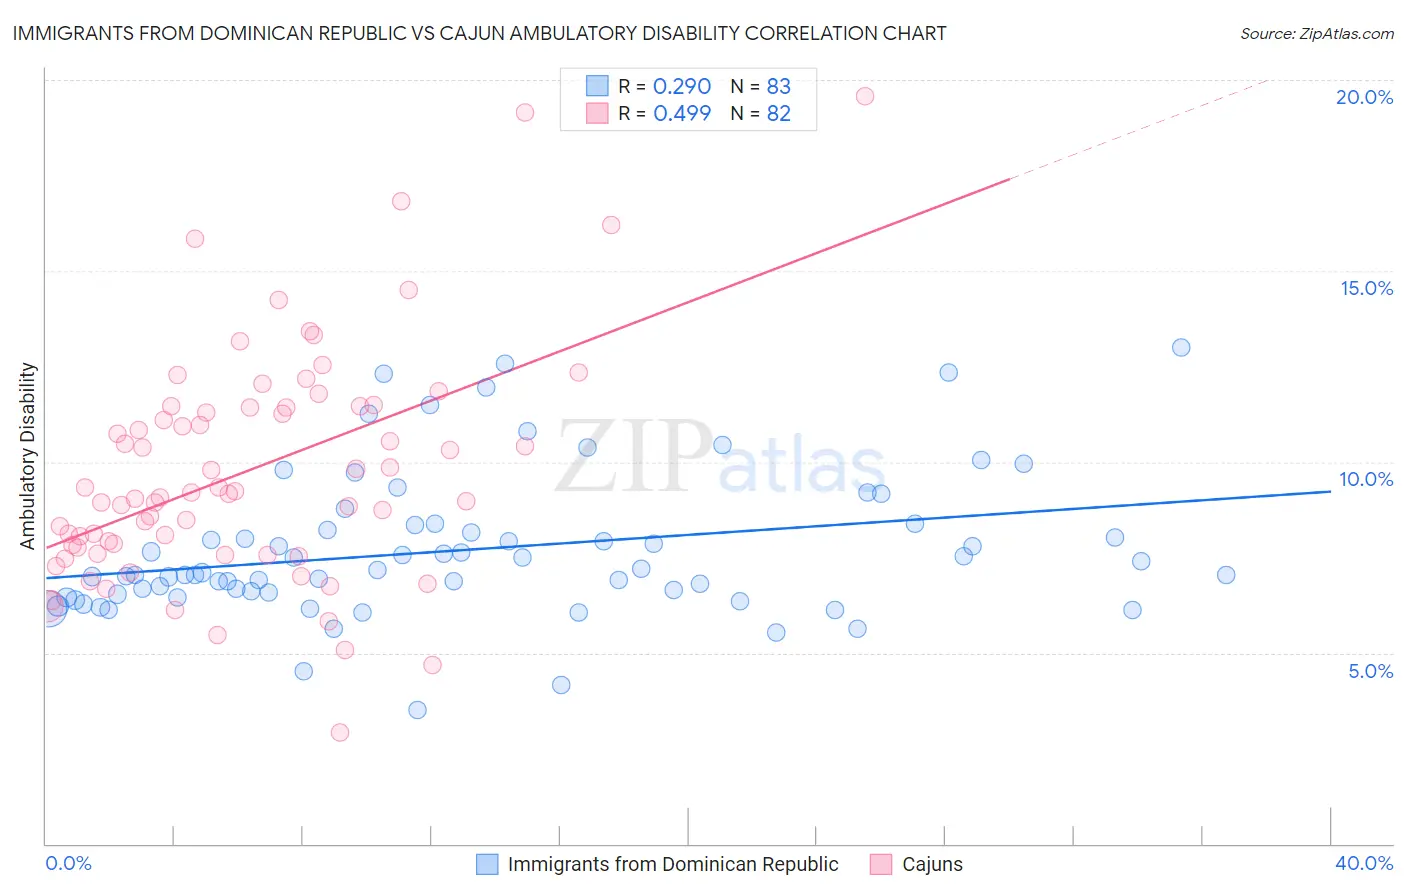
Immigrants from Dominican Republic vs Cajun Ambulatory Disability Correlation Chart
The statistical analysis conducted on geographies consisting of 275,045,081 people shows a weak positive correlation between the proportion of Immigrants from Dominican Republic and percentage of population with ambulatory disability in the United States with a correlation coefficient (R) of 0.290 and weighted average of 7.1%. Similarly, the statistical analysis conducted on geographies consisting of 149,692,949 people shows a moderate positive correlation between the proportion of Cajuns and percentage of population with ambulatory disability in the United States with a correlation coefficient (R) of 0.499 and weighted average of 7.8%, a difference of 8.9%.
Ambulatory Disability Correlation Summary
| Measurement | Immigrants from Dominican Republic | Cajun |
| Minimum | 3.5% | 2.9% |
| Maximum | 13.0% | 19.6% |
| Range | 9.5% | 16.7% |
| Mean | 7.7% | 9.8% |
| Median | 7.1% | 9.2% |
| Interquartile 25% (IQ1) | 6.5% | 7.7% |
| Interquartile 75% (IQ3) | 8.3% | 11.4% |
| Interquartile Range (IQR) | 1.8% | 3.7% |
| Standard Deviation (Sample) | 1.9% | 3.0% |
| Standard Deviation (Population) | 1.9% | 3.0% |
Demographics Similar to Immigrants from Dominican Republic and Cajuns by Ambulatory Disability
In terms of ambulatory disability, the demographic groups most similar to Immigrants from Dominican Republic are Central American Indian (7.2%, a difference of 0.080%), Ottawa (7.2%, a difference of 0.17%), Shoshone (7.1%, a difference of 0.24%), Blackfeet (7.1%, a difference of 0.26%), and Immigrants from Yemen (7.1%, a difference of 0.28%). Similarly, the demographic groups most similar to Cajuns are Menominee (7.8%, a difference of 0.28%), Cherokee (7.9%, a difference of 1.2%), Paiute (7.7%, a difference of 1.2%), Pueblo (7.6%, a difference of 2.5%), and Hopi (7.6%, a difference of 2.5%).
| Demographics | Rating | Rank | Ambulatory Disability |
| Immigrants | Yemen | 0.0 /100 | #313 | Tragic 7.1% |
| Blackfeet | 0.0 /100 | #314 | Tragic 7.1% |
| Shoshone | 0.0 /100 | #315 | Tragic 7.1% |
| Immigrants | Dominican Republic | 0.0 /100 | #316 | Tragic 7.1% |
| Central American Indians | 0.0 /100 | #317 | Tragic 7.2% |
| Ottawa | 0.0 /100 | #318 | Tragic 7.2% |
| Dominicans | 0.0 /100 | #319 | Tragic 7.2% |
| Potawatomi | 0.0 /100 | #320 | Tragic 7.3% |
| Apache | 0.0 /100 | #321 | Tragic 7.4% |
| Osage | 0.0 /100 | #322 | Tragic 7.4% |
| Americans | 0.0 /100 | #323 | Tragic 7.4% |
| Navajo | 0.0 /100 | #324 | Tragic 7.5% |
| Comanche | 0.0 /100 | #325 | Tragic 7.5% |
| Blacks/African Americans | 0.0 /100 | #326 | Tragic 7.5% |
| Natives/Alaskans | 0.0 /100 | #327 | Tragic 7.5% |
| Hopi | 0.0 /100 | #328 | Tragic 7.6% |
| Pueblo | 0.0 /100 | #329 | Tragic 7.6% |
| Paiute | 0.0 /100 | #330 | Tragic 7.7% |
| Cajuns | 0.0 /100 | #331 | Tragic 7.8% |
| Menominee | 0.0 /100 | #332 | Tragic 7.8% |
| Cherokee | 0.0 /100 | #333 | Tragic 7.9% |