Immigrants from Dominican Republic vs African Disability Age 35 to 64
COMPARE
Immigrants from Dominican Republic
African
Disability Age 35 to 64
Disability Age 35 to 64 Comparison
Immigrants from Dominican Republic
Africans
12.9%
DISABILITY AGE 35 TO 64
0.1/ 100
METRIC RATING
277th/ 347
METRIC RANK
13.6%
DISABILITY AGE 35 TO 64
0.0/ 100
METRIC RATING
296th/ 347
METRIC RANK
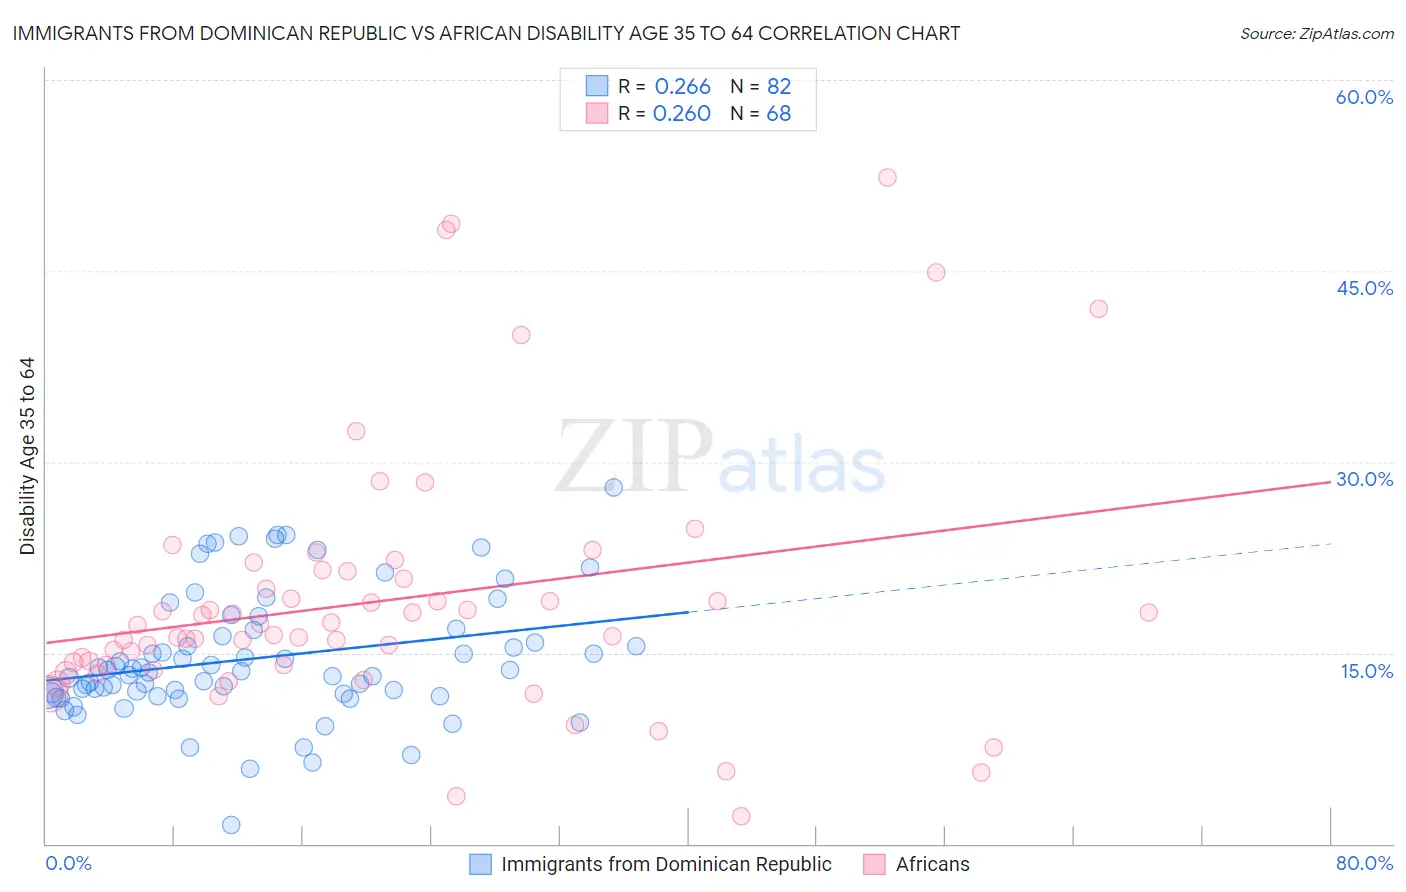
Immigrants from Dominican Republic vs African Disability Age 35 to 64 Correlation Chart
The statistical analysis conducted on geographies consisting of 274,934,526 people shows a weak positive correlation between the proportion of Immigrants from Dominican Republic and percentage of population with a disability between the ages 34 and 64 in the United States with a correlation coefficient (R) of 0.266 and weighted average of 12.9%. Similarly, the statistical analysis conducted on geographies consisting of 469,523,166 people shows a weak positive correlation between the proportion of Africans and percentage of population with a disability between the ages 34 and 64 in the United States with a correlation coefficient (R) of 0.260 and weighted average of 13.6%, a difference of 5.2%.
Disability Age 35 to 64 Correlation Summary
| Measurement | Immigrants from Dominican Republic | African |
| Minimum | 1.4% | 2.2% |
| Maximum | 28.0% | 52.4% |
| Range | 26.6% | 50.2% |
| Mean | 14.6% | 19.1% |
| Median | 13.6% | 16.8% |
| Interquartile 25% (IQ1) | 11.9% | 14.0% |
| Interquartile 75% (IQ3) | 16.8% | 21.1% |
| Interquartile Range (IQR) | 5.0% | 7.1% |
| Standard Deviation (Sample) | 4.9% | 10.1% |
| Standard Deviation (Population) | 4.9% | 10.0% |
Demographics Similar to Immigrants from Dominican Republic and Africans by Disability Age 35 to 64
In terms of disability age 35 to 64, the demographic groups most similar to Immigrants from Dominican Republic are French Canadian (12.9%, a difference of 0.030%), Immigrants from Micronesia (12.9%, a difference of 0.050%), Somali (12.9%, a difference of 0.20%), Liberian (12.9%, a difference of 0.22%), and Scotch-Irish (13.0%, a difference of 0.42%). Similarly, the demographic groups most similar to Africans are Yakama (13.6%, a difference of 0.22%), Yaqui (13.5%, a difference of 0.90%), Ute (13.4%, a difference of 1.5%), Puget Sound Salish (13.3%, a difference of 2.0%), and Immigrants from Congo (13.3%, a difference of 2.0%).
| Demographics | Rating | Rank | Disability Age 35 to 64 |
| Somalis | 0.1 /100 | #276 | Tragic 12.9% |
| Immigrants | Dominican Republic | 0.1 /100 | #277 | Tragic 12.9% |
| French Canadians | 0.1 /100 | #278 | Tragic 12.9% |
| Immigrants | Micronesia | 0.1 /100 | #279 | Tragic 12.9% |
| Liberians | 0.1 /100 | #280 | Tragic 12.9% |
| Scotch-Irish | 0.1 /100 | #281 | Tragic 13.0% |
| Immigrants | Laos | 0.1 /100 | #282 | Tragic 13.0% |
| Central American Indians | 0.0 /100 | #283 | Tragic 13.0% |
| Immigrants | Nonimmigrants | 0.0 /100 | #284 | Tragic 13.0% |
| Immigrants | Somalia | 0.0 /100 | #285 | Tragic 13.1% |
| Hmong | 0.0 /100 | #286 | Tragic 13.1% |
| Tlingit-Haida | 0.0 /100 | #287 | Tragic 13.2% |
| Fijians | 0.0 /100 | #288 | Tragic 13.2% |
| Indonesians | 0.0 /100 | #289 | Tragic 13.2% |
| Immigrants | Liberia | 0.0 /100 | #290 | Tragic 13.2% |
| Immigrants | Congo | 0.0 /100 | #291 | Tragic 13.3% |
| Puget Sound Salish | 0.0 /100 | #292 | Tragic 13.3% |
| Ute | 0.0 /100 | #293 | Tragic 13.4% |
| Yaqui | 0.0 /100 | #294 | Tragic 13.5% |
| Yakama | 0.0 /100 | #295 | Tragic 13.6% |
| Africans | 0.0 /100 | #296 | Tragic 13.6% |