Immigrants from Dominica vs Lithuanian Disability Age 65 to 74
COMPARE
Immigrants from Dominica
Lithuanian
Disability Age 65 to 74
Disability Age 65 to 74 Comparison
Immigrants from Dominica
Lithuanians
25.7%
DISABILITY AGE 65 TO 74
0.1/ 100
METRIC RATING
272nd/ 347
METRIC RANK
21.4%
DISABILITY AGE 65 TO 74
99.7/ 100
METRIC RATING
48th/ 347
METRIC RANK
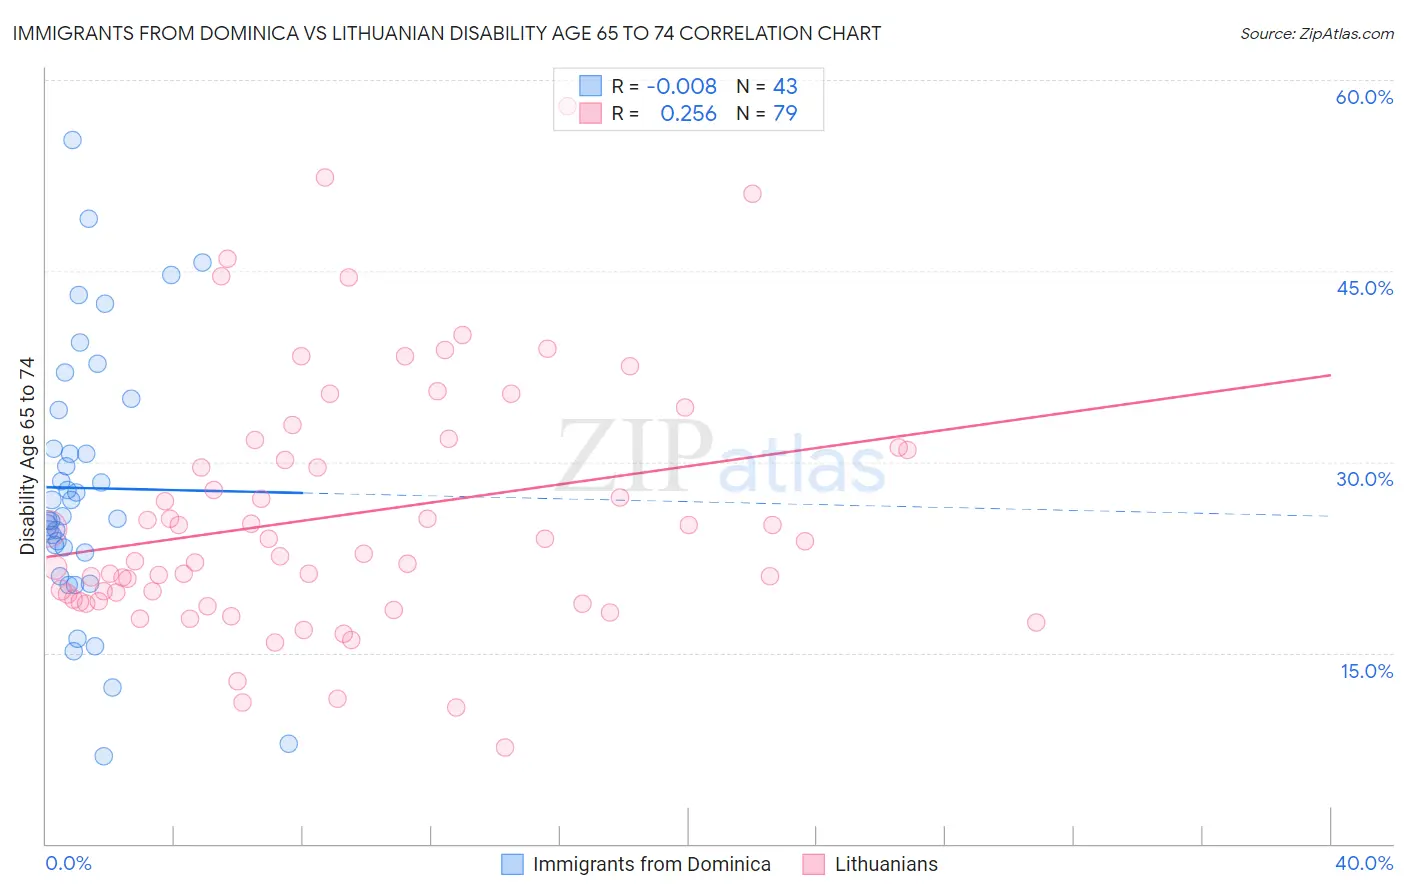
Immigrants from Dominica vs Lithuanian Disability Age 65 to 74 Correlation Chart
The statistical analysis conducted on geographies consisting of 83,763,598 people shows no correlation between the proportion of Immigrants from Dominica and percentage of population with a disability between the ages 65 and 75 in the United States with a correlation coefficient (R) of -0.008 and weighted average of 25.7%. Similarly, the statistical analysis conducted on geographies consisting of 421,207,937 people shows a weak positive correlation between the proportion of Lithuanians and percentage of population with a disability between the ages 65 and 75 in the United States with a correlation coefficient (R) of 0.256 and weighted average of 21.4%, a difference of 20.1%.
Disability Age 65 to 74 Correlation Summary
| Measurement | Immigrants from Dominica | Lithuanian |
| Minimum | 6.9% | 7.6% |
| Maximum | 55.3% | 57.9% |
| Range | 48.4% | 50.3% |
| Mean | 27.9% | 25.8% |
| Median | 25.7% | 22.8% |
| Interquartile 25% (IQ1) | 22.9% | 19.1% |
| Interquartile 75% (IQ3) | 34.1% | 31.1% |
| Interquartile Range (IQR) | 11.3% | 12.0% |
| Standard Deviation (Sample) | 10.4% | 9.9% |
| Standard Deviation (Population) | 10.3% | 9.9% |
Similar Demographics by Disability Age 65 to 74
Demographics Similar to Immigrants from Dominica by Disability Age 65 to 74
In terms of disability age 65 to 74, the demographic groups most similar to Immigrants from Dominica are Immigrants from Liberia (25.7%, a difference of 0.0%), Immigrants from Guatemala (25.7%, a difference of 0.030%), Hmong (25.7%, a difference of 0.11%), Japanese (25.7%, a difference of 0.13%), and Liberian (25.6%, a difference of 0.23%).
| Demographics | Rating | Rank | Disability Age 65 to 74 |
| Guatemalans | 0.2 /100 | #265 | Tragic 25.5% |
| Immigrants | Latin America | 0.1 /100 | #266 | Tragic 25.6% |
| Ottawa | 0.1 /100 | #267 | Tragic 25.6% |
| Liberians | 0.1 /100 | #268 | Tragic 25.6% |
| Hmong | 0.1 /100 | #269 | Tragic 25.7% |
| Immigrants | Guatemala | 0.1 /100 | #270 | Tragic 25.7% |
| Immigrants | Liberia | 0.1 /100 | #271 | Tragic 25.7% |
| Immigrants | Dominica | 0.1 /100 | #272 | Tragic 25.7% |
| Japanese | 0.1 /100 | #273 | Tragic 25.7% |
| Americans | 0.1 /100 | #274 | Tragic 25.8% |
| Hondurans | 0.1 /100 | #275 | Tragic 25.8% |
| French American Indians | 0.1 /100 | #276 | Tragic 25.8% |
| Belizeans | 0.1 /100 | #277 | Tragic 25.8% |
| Immigrants | Belize | 0.1 /100 | #278 | Tragic 25.8% |
| U.S. Virgin Islanders | 0.1 /100 | #279 | Tragic 25.9% |
Demographics Similar to Lithuanians by Disability Age 65 to 74
In terms of disability age 65 to 74, the demographic groups most similar to Lithuanians are Luxembourger (21.4%, a difference of 0.010%), Immigrants from Malaysia (21.4%, a difference of 0.030%), Immigrants from Turkey (21.4%, a difference of 0.050%), Immigrants from Bulgaria (21.4%, a difference of 0.050%), and Asian (21.4%, a difference of 0.080%).
| Demographics | Rating | Rank | Disability Age 65 to 74 |
| Immigrants | Austria | 99.8 /100 | #41 | Exceptional 21.2% |
| Macedonians | 99.7 /100 | #42 | Exceptional 21.3% |
| Immigrants | Croatia | 99.7 /100 | #43 | Exceptional 21.3% |
| Estonians | 99.7 /100 | #44 | Exceptional 21.4% |
| Asians | 99.7 /100 | #45 | Exceptional 21.4% |
| Immigrants | Turkey | 99.7 /100 | #46 | Exceptional 21.4% |
| Immigrants | Bulgaria | 99.7 /100 | #47 | Exceptional 21.4% |
| Lithuanians | 99.7 /100 | #48 | Exceptional 21.4% |
| Luxembourgers | 99.7 /100 | #49 | Exceptional 21.4% |
| Immigrants | Malaysia | 99.7 /100 | #50 | Exceptional 21.4% |
| Immigrants | Serbia | 99.6 /100 | #51 | Exceptional 21.4% |
| Immigrants | France | 99.6 /100 | #52 | Exceptional 21.5% |
| Bhutanese | 99.6 /100 | #53 | Exceptional 21.5% |
| Immigrants | Italy | 99.6 /100 | #54 | Exceptional 21.5% |
| Immigrants | Romania | 99.5 /100 | #55 | Exceptional 21.5% |