Immigrants from Cuba vs White/Caucasian Disability Age Over 75
COMPARE
Immigrants from Cuba
White/Caucasian
Disability Age Over 75
Disability Age Over 75 Comparison
Immigrants from Cuba
Whites/Caucasians
47.7%
DISABILITY AGE OVER 75
20.9/ 100
METRIC RATING
201st/ 347
METRIC RANK
47.3%
DISABILITY AGE OVER 75
50.0/ 100
METRIC RATING
174th/ 347
METRIC RANK
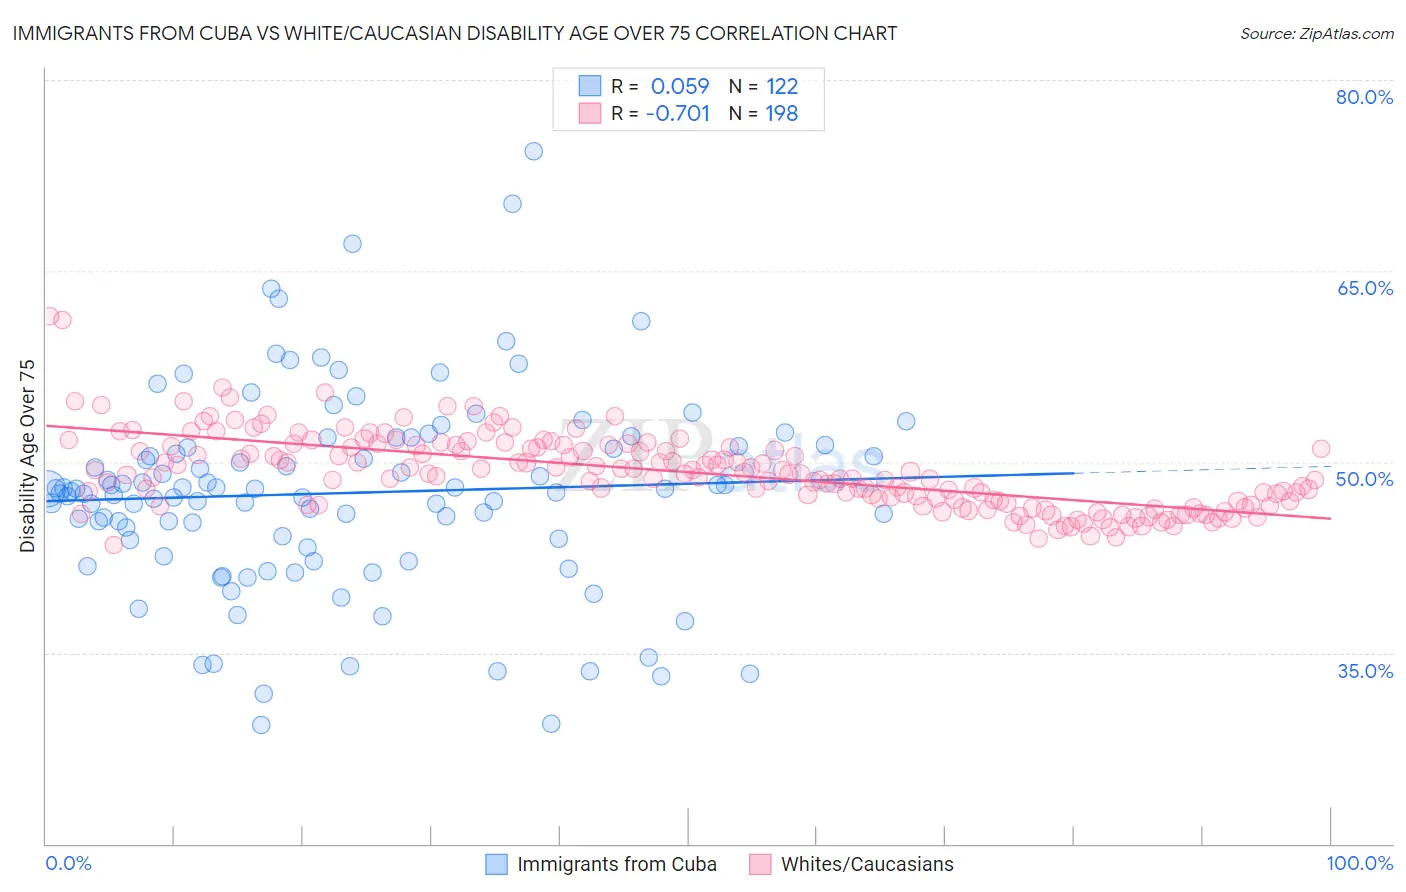
Immigrants from Cuba vs White/Caucasian Disability Age Over 75 Correlation Chart
The statistical analysis conducted on geographies consisting of 325,674,246 people shows a slight positive correlation between the proportion of Immigrants from Cuba and percentage of population with a disability over the age of 75 in the United States with a correlation coefficient (R) of 0.059 and weighted average of 47.7%. Similarly, the statistical analysis conducted on geographies consisting of 580,540,031 people shows a strong negative correlation between the proportion of Whites/Caucasians and percentage of population with a disability over the age of 75 in the United States with a correlation coefficient (R) of -0.701 and weighted average of 47.3%, a difference of 0.75%.
Disability Age Over 75 Correlation Summary
| Measurement | Immigrants from Cuba | White/Caucasian |
| Minimum | 29.3% | 43.5% |
| Maximum | 74.4% | 61.5% |
| Range | 45.1% | 18.0% |
| Mean | 47.5% | 49.2% |
| Median | 47.8% | 49.0% |
| Interquartile 25% (IQ1) | 43.9% | 46.7% |
| Interquartile 75% (IQ3) | 51.2% | 51.2% |
| Interquartile Range (IQR) | 7.3% | 4.5% |
| Standard Deviation (Sample) | 7.8% | 3.0% |
| Standard Deviation (Population) | 7.7% | 3.0% |
Similar Demographics by Disability Age Over 75
Demographics Similar to Immigrants from Cuba by Disability Age Over 75
In terms of disability age over 75, the demographic groups most similar to Immigrants from Cuba are Immigrants from Bahamas (47.7%, a difference of 0.010%), Immigrants from Somalia (47.7%, a difference of 0.020%), Trinidadian and Tobagonian (47.7%, a difference of 0.030%), Immigrants from Eritrea (47.7%, a difference of 0.050%), and Nigerian (47.7%, a difference of 0.060%).
| Demographics | Rating | Rank | Disability Age Over 75 |
| Immigrants | Lebanon | 26.5 /100 | #194 | Fair 47.6% |
| Immigrants | Trinidad and Tobago | 25.3 /100 | #195 | Fair 47.6% |
| Immigrants | Portugal | 23.8 /100 | #196 | Fair 47.6% |
| Pakistanis | 23.4 /100 | #197 | Fair 47.7% |
| Immigrants | Ukraine | 23.2 /100 | #198 | Fair 47.7% |
| Immigrants | Eritrea | 22.4 /100 | #199 | Fair 47.7% |
| Immigrants | Somalia | 21.4 /100 | #200 | Fair 47.7% |
| Immigrants | Cuba | 20.9 /100 | #201 | Fair 47.7% |
| Immigrants | Bahamas | 20.7 /100 | #202 | Fair 47.7% |
| Trinidadians and Tobagonians | 20.0 /100 | #203 | Fair 47.7% |
| Nigerians | 19.2 /100 | #204 | Poor 47.7% |
| Immigrants | Ghana | 19.1 /100 | #205 | Poor 47.7% |
| Jamaicans | 19.0 /100 | #206 | Poor 47.7% |
| Immigrants | Syria | 17.4 /100 | #207 | Poor 47.8% |
| Immigrants | Senegal | 16.9 /100 | #208 | Poor 47.8% |
Demographics Similar to Whites/Caucasians by Disability Age Over 75
In terms of disability age over 75, the demographic groups most similar to Whites/Caucasians are Immigrants from Haiti (47.3%, a difference of 0.010%), Alsatian (47.3%, a difference of 0.040%), Scotch-Irish (47.3%, a difference of 0.060%), Ecuadorian (47.4%, a difference of 0.070%), and Immigrants from Africa (47.3%, a difference of 0.080%).
| Demographics | Rating | Rank | Disability Age Over 75 |
| Moroccans | 62.9 /100 | #167 | Good 47.2% |
| Kenyans | 58.8 /100 | #168 | Average 47.2% |
| Celtics | 58.7 /100 | #169 | Average 47.2% |
| German Russians | 56.2 /100 | #170 | Average 47.3% |
| Immigrants | Africa | 53.6 /100 | #171 | Average 47.3% |
| Scotch-Irish | 52.5 /100 | #172 | Average 47.3% |
| Alsatians | 51.9 /100 | #173 | Average 47.3% |
| Whites/Caucasians | 50.0 /100 | #174 | Average 47.3% |
| Immigrants | Haiti | 49.7 /100 | #175 | Average 47.3% |
| Ecuadorians | 46.7 /100 | #176 | Average 47.4% |
| Haitians | 44.6 /100 | #177 | Average 47.4% |
| Cubans | 42.1 /100 | #178 | Average 47.4% |
| Sierra Leoneans | 41.7 /100 | #179 | Average 47.4% |
| Immigrants | Ecuador | 41.7 /100 | #180 | Average 47.4% |
| Immigrants | Kazakhstan | 40.4 /100 | #181 | Average 47.4% |