Immigrants from Cuba vs Costa Rican Disability Age 18 to 34
COMPARE
Immigrants from Cuba
Costa Rican
Disability Age 18 to 34
Disability Age 18 to 34 Comparison
Immigrants from Cuba
Costa Ricans
5.4%
DISABILITY AGE 18 TO 34
100.0/ 100
METRIC RATING
4th/ 347
METRIC RANK
6.3%
DISABILITY AGE 18 TO 34
92.9/ 100
METRIC RATING
123rd/ 347
METRIC RANK
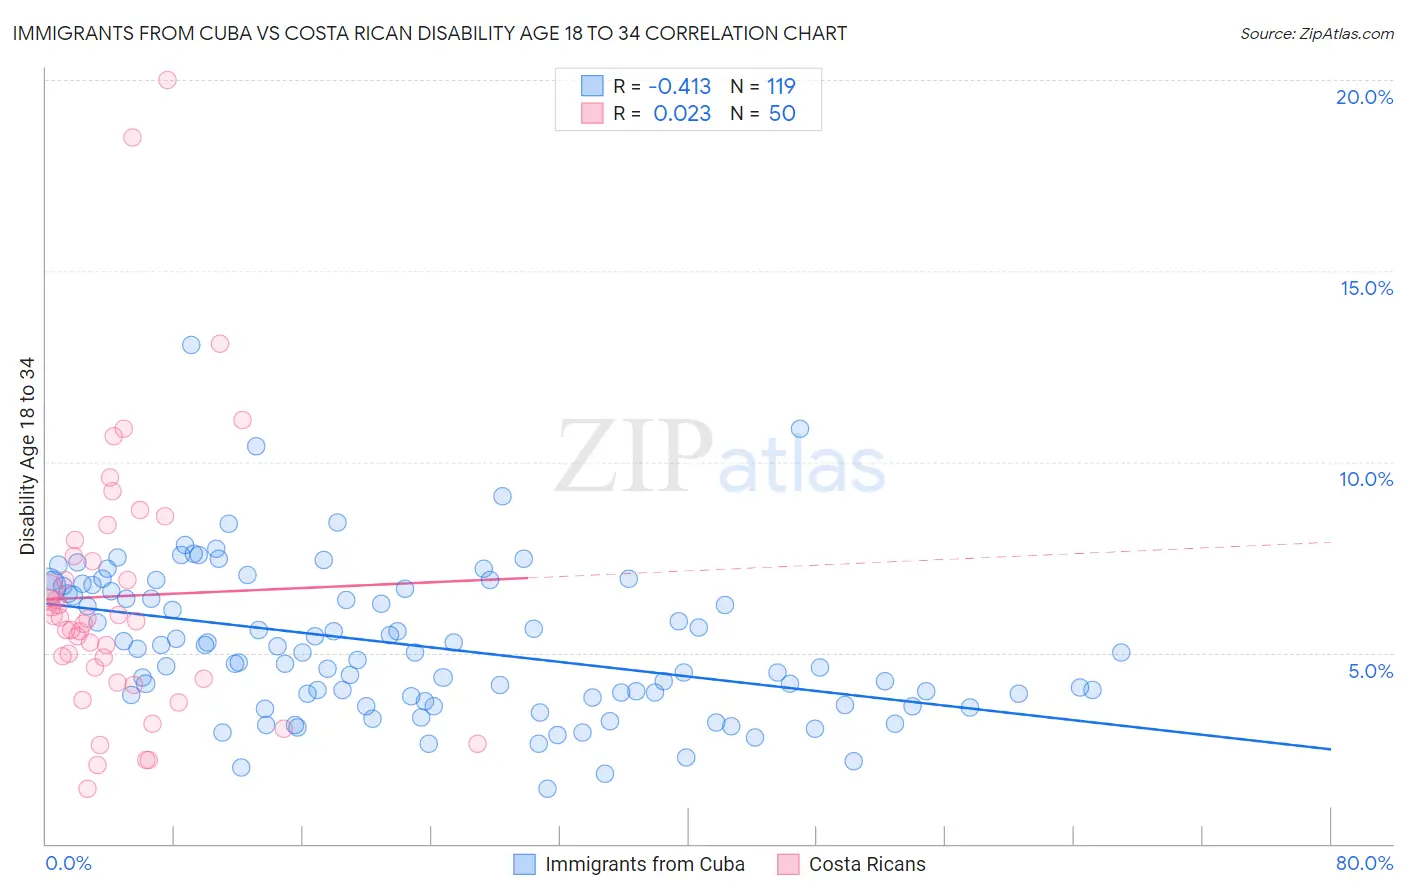
Immigrants from Cuba vs Costa Rican Disability Age 18 to 34 Correlation Chart
The statistical analysis conducted on geographies consisting of 325,387,969 people shows a moderate negative correlation between the proportion of Immigrants from Cuba and percentage of population with a disability between the ages 18 and 35 in the United States with a correlation coefficient (R) of -0.413 and weighted average of 5.4%. Similarly, the statistical analysis conducted on geographies consisting of 253,342,292 people shows no correlation between the proportion of Costa Ricans and percentage of population with a disability between the ages 18 and 35 in the United States with a correlation coefficient (R) of 0.023 and weighted average of 6.3%, a difference of 17.6%.
Disability Age 18 to 34 Correlation Summary
| Measurement | Immigrants from Cuba | Costa Rican |
| Minimum | 1.5% | 1.4% |
| Maximum | 13.1% | 20.0% |
| Range | 11.6% | 18.6% |
| Mean | 5.2% | 6.5% |
| Median | 5.0% | 5.9% |
| Interquartile 25% (IQ1) | 3.8% | 4.3% |
| Interquartile 75% (IQ3) | 6.7% | 7.5% |
| Interquartile Range (IQR) | 2.8% | 3.2% |
| Standard Deviation (Sample) | 2.0% | 3.6% |
| Standard Deviation (Population) | 1.9% | 3.6% |
Similar Demographics by Disability Age 18 to 34
Demographics Similar to Immigrants from Cuba by Disability Age 18 to 34
In terms of disability age 18 to 34, the demographic groups most similar to Immigrants from Cuba are Immigrants from Taiwan (5.4%, a difference of 0.28%), Immigrants from Grenada (5.3%, a difference of 0.65%), Filipino (5.4%, a difference of 1.5%), Immigrants from China (5.4%, a difference of 1.6%), and Immigrants from Guyana (5.5%, a difference of 2.2%).
| Demographics | Rating | Rank | Disability Age 18 to 34 |
| Immigrants | Armenia | 100.0 /100 | #1 | Exceptional 5.0% |
| Immigrants | Hong Kong | 100.0 /100 | #2 | Exceptional 5.2% |
| Immigrants | Grenada | 100.0 /100 | #3 | Exceptional 5.3% |
| Immigrants | Cuba | 100.0 /100 | #4 | Exceptional 5.4% |
| Immigrants | Taiwan | 100.0 /100 | #5 | Exceptional 5.4% |
| Filipinos | 100.0 /100 | #6 | Exceptional 5.4% |
| Immigrants | China | 100.0 /100 | #7 | Exceptional 5.4% |
| Immigrants | Guyana | 100.0 /100 | #8 | Exceptional 5.5% |
| Guyanese | 100.0 /100 | #9 | Exceptional 5.5% |
| Immigrants | Uzbekistan | 100.0 /100 | #10 | Exceptional 5.5% |
| Vietnamese | 100.0 /100 | #11 | Exceptional 5.5% |
| Immigrants | St. Vincent and the Grenadines | 100.0 /100 | #12 | Exceptional 5.5% |
| Immigrants | Iran | 100.0 /100 | #13 | Exceptional 5.5% |
| Indians (Asian) | 100.0 /100 | #14 | Exceptional 5.5% |
| Immigrants | India | 100.0 /100 | #15 | Exceptional 5.6% |
Demographics Similar to Costa Ricans by Disability Age 18 to 34
In terms of disability age 18 to 34, the demographic groups most similar to Costa Ricans are Immigrants from Morocco (6.3%, a difference of 0.020%), Macedonian (6.3%, a difference of 0.080%), Immigrants from Czechoslovakia (6.3%, a difference of 0.11%), Immigrants from Switzerland (6.3%, a difference of 0.11%), and Immigrants from Guatemala (6.3%, a difference of 0.12%).
| Demographics | Rating | Rank | Disability Age 18 to 34 |
| Immigrants | Costa Rica | 94.0 /100 | #116 | Exceptional 6.3% |
| Immigrants | Jordan | 94.0 /100 | #117 | Exceptional 6.3% |
| Immigrants | Nepal | 93.7 /100 | #118 | Exceptional 6.3% |
| Chileans | 93.5 /100 | #119 | Exceptional 6.3% |
| Immigrants | Ukraine | 93.4 /100 | #120 | Exceptional 6.3% |
| Immigrants | Guatemala | 93.4 /100 | #121 | Exceptional 6.3% |
| Immigrants | Czechoslovakia | 93.3 /100 | #122 | Exceptional 6.3% |
| Costa Ricans | 92.9 /100 | #123 | Exceptional 6.3% |
| Immigrants | Morocco | 92.9 /100 | #124 | Exceptional 6.3% |
| Macedonians | 92.6 /100 | #125 | Exceptional 6.3% |
| Immigrants | Switzerland | 92.5 /100 | #126 | Exceptional 6.3% |
| West Indians | 92.0 /100 | #127 | Exceptional 6.3% |
| Chinese | 91.9 /100 | #128 | Exceptional 6.3% |
| Immigrants | Italy | 90.5 /100 | #129 | Exceptional 6.3% |
| Immigrants | Dominica | 90.5 /100 | #130 | Exceptional 6.3% |