Immigrants from Costa Rica vs Blackfeet Disability Age 35 to 64
COMPARE
Immigrants from Costa Rica
Blackfeet
Disability Age 35 to 64
Disability Age 35 to 64 Comparison
Immigrants from Costa Rica
Blackfeet
10.7%
DISABILITY AGE 35 TO 64
91.7/ 100
METRIC RATING
137th/ 347
METRIC RANK
14.1%
DISABILITY AGE 35 TO 64
0.0/ 100
METRIC RATING
307th/ 347
METRIC RANK
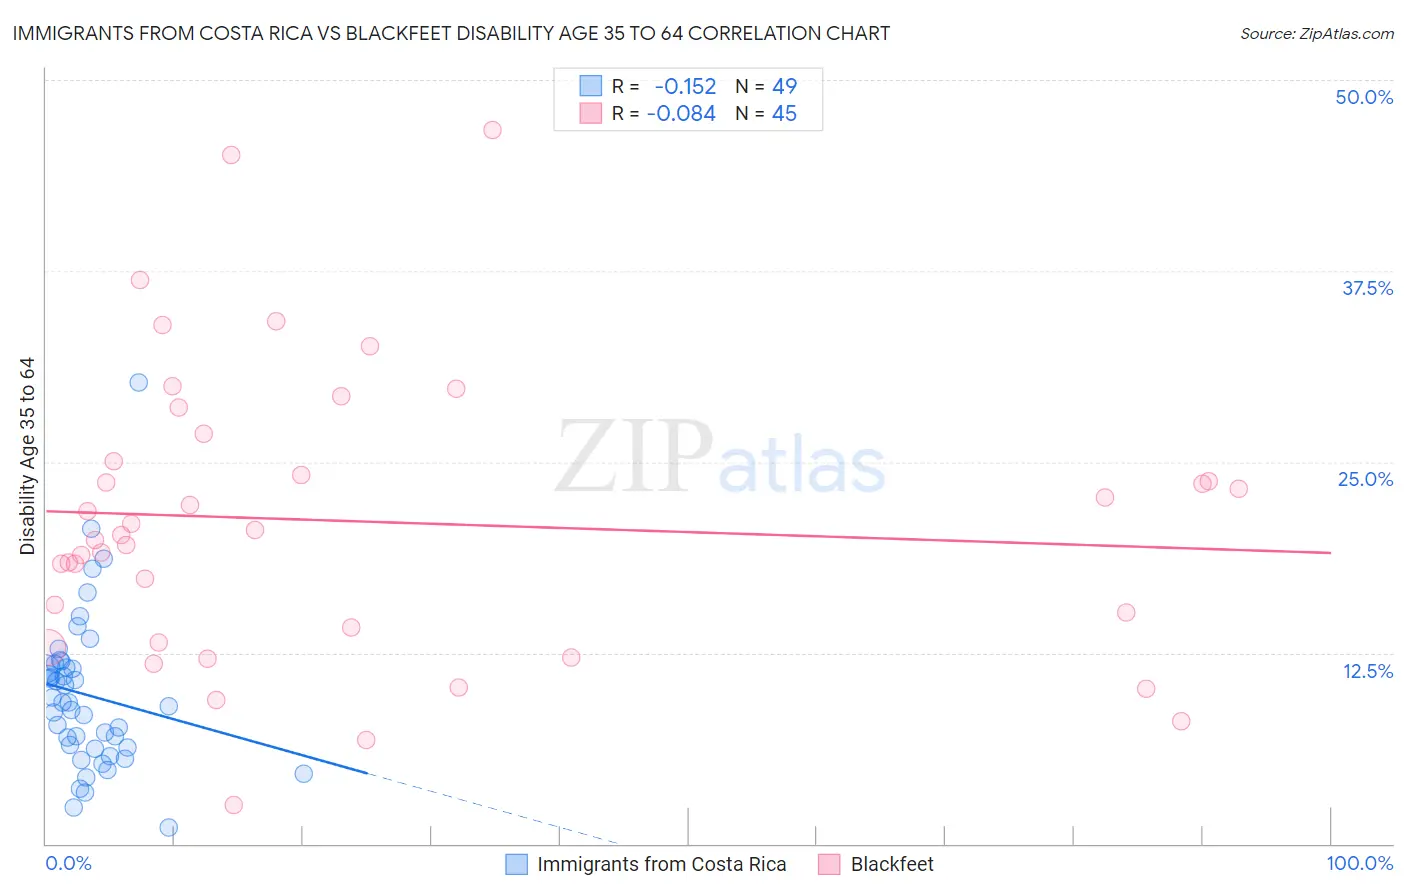
Immigrants from Costa Rica vs Blackfeet Disability Age 35 to 64 Correlation Chart
The statistical analysis conducted on geographies consisting of 204,238,582 people shows a poor negative correlation between the proportion of Immigrants from Costa Rica and percentage of population with a disability between the ages 34 and 64 in the United States with a correlation coefficient (R) of -0.152 and weighted average of 10.7%. Similarly, the statistical analysis conducted on geographies consisting of 309,440,596 people shows a slight negative correlation between the proportion of Blackfeet and percentage of population with a disability between the ages 34 and 64 in the United States with a correlation coefficient (R) of -0.084 and weighted average of 14.1%, a difference of 31.0%.
Disability Age 35 to 64 Correlation Summary
| Measurement | Immigrants from Costa Rica | Blackfeet |
| Minimum | 1.1% | 2.5% |
| Maximum | 30.2% | 46.7% |
| Range | 29.1% | 44.2% |
| Mean | 9.7% | 21.1% |
| Median | 9.2% | 20.2% |
| Interquartile 25% (IQ1) | 6.3% | 13.7% |
| Interquartile 75% (IQ3) | 11.7% | 25.9% |
| Interquartile Range (IQR) | 5.4% | 12.3% |
| Standard Deviation (Sample) | 5.1% | 9.5% |
| Standard Deviation (Population) | 5.1% | 9.4% |
Similar Demographics by Disability Age 35 to 64
Demographics Similar to Immigrants from Costa Rica by Disability Age 35 to 64
In terms of disability age 35 to 64, the demographic groups most similar to Immigrants from Costa Rica are Immigrants from Southern Europe (10.7%, a difference of 0.050%), Costa Rican (10.7%, a difference of 0.060%), Salvadoran (10.7%, a difference of 0.070%), Immigrants from Scotland (10.7%, a difference of 0.12%), and Greek (10.7%, a difference of 0.18%).
| Demographics | Rating | Rank | Disability Age 35 to 64 |
| Immigrants | Syria | 93.0 /100 | #130 | Exceptional 10.7% |
| Immigrants | El Salvador | 92.8 /100 | #131 | Exceptional 10.7% |
| Immigrants | Albania | 92.5 /100 | #132 | Exceptional 10.7% |
| Immigrants | Immigrants | 92.5 /100 | #133 | Exceptional 10.7% |
| Immigrants | Ecuador | 92.5 /100 | #134 | Exceptional 10.7% |
| Greeks | 92.3 /100 | #135 | Exceptional 10.7% |
| Salvadorans | 91.9 /100 | #136 | Exceptional 10.7% |
| Immigrants | Costa Rica | 91.7 /100 | #137 | Exceptional 10.7% |
| Immigrants | Southern Europe | 91.5 /100 | #138 | Exceptional 10.7% |
| Costa Ricans | 91.4 /100 | #139 | Exceptional 10.7% |
| Immigrants | Scotland | 91.3 /100 | #140 | Exceptional 10.7% |
| Australians | 90.7 /100 | #141 | Exceptional 10.8% |
| Immigrants | Saudi Arabia | 90.6 /100 | #142 | Exceptional 10.8% |
| Sierra Leoneans | 89.7 /100 | #143 | Excellent 10.8% |
| Lithuanians | 88.7 /100 | #144 | Excellent 10.8% |
Demographics Similar to Blackfeet by Disability Age 35 to 64
In terms of disability age 35 to 64, the demographic groups most similar to Blackfeet are Inupiat (14.1%, a difference of 0.030%), Cree (14.1%, a difference of 0.10%), Immigrants from Yemen (14.0%, a difference of 0.16%), Cape Verdean (14.1%, a difference of 0.57%), and American (13.9%, a difference of 1.0%).
| Demographics | Rating | Rank | Disability Age 35 to 64 |
| Delaware | 0.0 /100 | #300 | Tragic 13.7% |
| French American Indians | 0.0 /100 | #301 | Tragic 13.7% |
| Aleuts | 0.0 /100 | #302 | Tragic 13.8% |
| Sioux | 0.0 /100 | #303 | Tragic 13.9% |
| Hopi | 0.0 /100 | #304 | Tragic 13.9% |
| Americans | 0.0 /100 | #305 | Tragic 13.9% |
| Immigrants | Yemen | 0.0 /100 | #306 | Tragic 14.0% |
| Blackfeet | 0.0 /100 | #307 | Tragic 14.1% |
| Inupiat | 0.0 /100 | #308 | Tragic 14.1% |
| Cree | 0.0 /100 | #309 | Tragic 14.1% |
| Cape Verdeans | 0.0 /100 | #310 | Tragic 14.1% |
| Immigrants | Azores | 0.0 /100 | #311 | Tragic 14.3% |
| Paiute | 0.0 /100 | #312 | Tragic 14.3% |
| Iroquois | 0.0 /100 | #313 | Tragic 14.4% |
| Shoshone | 0.0 /100 | #314 | Tragic 14.5% |