Immigrants from Colombia vs Cherokee Cognitive Disability
COMPARE
Immigrants from Colombia
Cherokee
Cognitive Disability
Cognitive Disability Comparison
Immigrants from Colombia
Cherokee
16.5%
COGNITIVE DISABILITY
99.8/ 100
METRIC RATING
46th/ 347
METRIC RANK
18.0%
COGNITIVE DISABILITY
0.3/ 100
METRIC RATING
268th/ 347
METRIC RANK
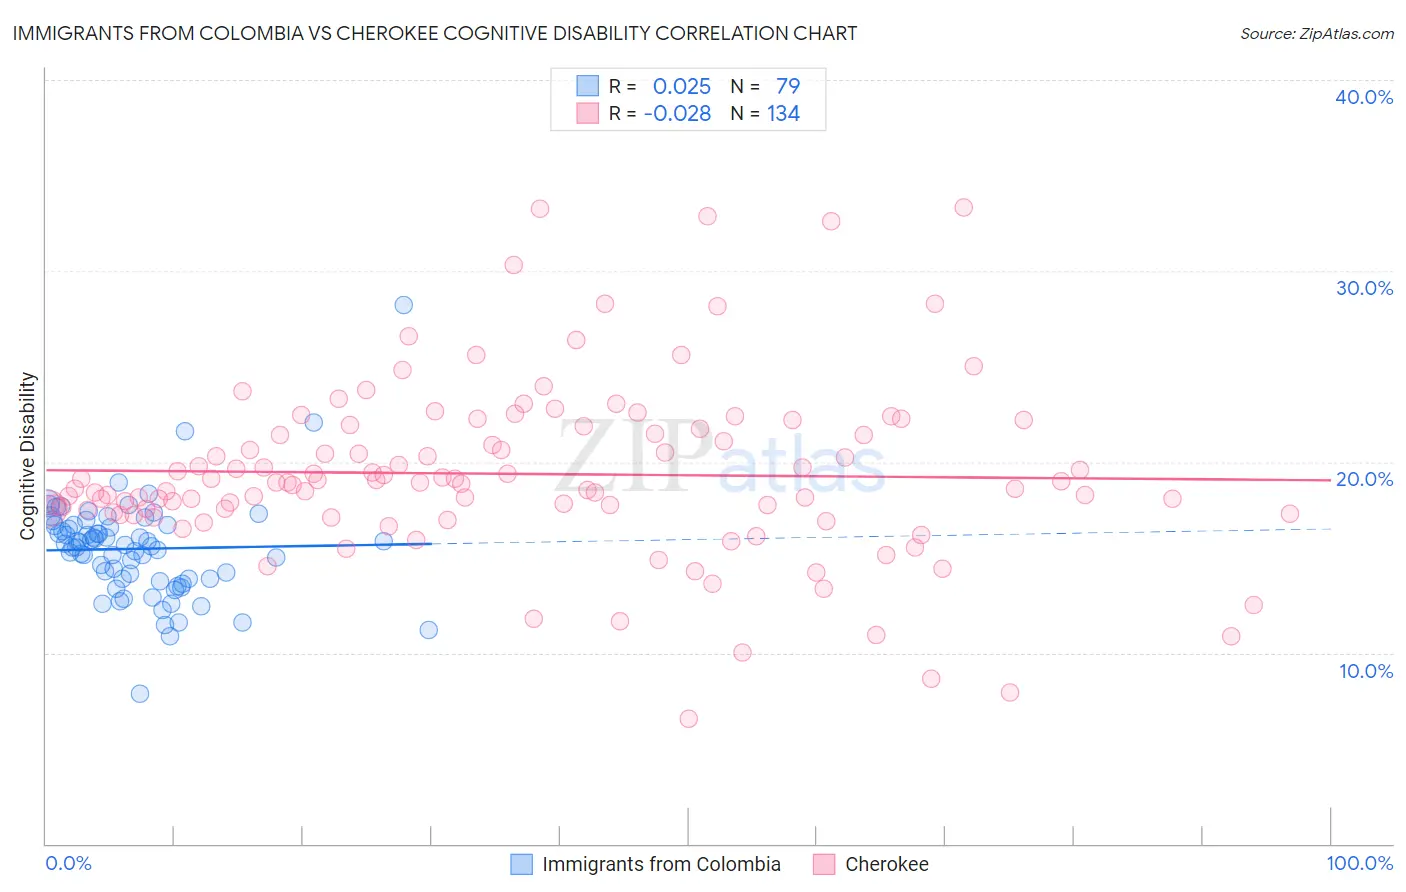
Immigrants from Colombia vs Cherokee Cognitive Disability Correlation Chart
The statistical analysis conducted on geographies consisting of 378,642,533 people shows no correlation between the proportion of Immigrants from Colombia and percentage of population with cognitive disability in the United States with a correlation coefficient (R) of 0.025 and weighted average of 16.5%. Similarly, the statistical analysis conducted on geographies consisting of 493,579,775 people shows no correlation between the proportion of Cherokee and percentage of population with cognitive disability in the United States with a correlation coefficient (R) of -0.028 and weighted average of 18.0%, a difference of 9.0%.
Cognitive Disability Correlation Summary
| Measurement | Immigrants from Colombia | Cherokee |
| Minimum | 7.9% | 6.5% |
| Maximum | 28.2% | 33.3% |
| Range | 20.3% | 26.8% |
| Mean | 15.4% | 19.4% |
| Median | 15.7% | 18.9% |
| Interquartile 25% (IQ1) | 13.9% | 17.4% |
| Interquartile 75% (IQ3) | 16.7% | 21.8% |
| Interquartile Range (IQR) | 2.8% | 4.4% |
| Standard Deviation (Sample) | 2.7% | 4.6% |
| Standard Deviation (Population) | 2.7% | 4.6% |
Similar Demographics by Cognitive Disability
Demographics Similar to Immigrants from Colombia by Cognitive Disability
In terms of cognitive disability, the demographic groups most similar to Immigrants from Colombia are Immigrants from Europe (16.5%, a difference of 0.010%), Macedonian (16.5%, a difference of 0.020%), Immigrants from Italy (16.5%, a difference of 0.030%), Immigrants from North America (16.5%, a difference of 0.030%), and Immigrants from Canada (16.5%, a difference of 0.050%).
| Demographics | Rating | Rank | Cognitive Disability |
| Bolivians | 99.9 /100 | #39 | Exceptional 16.5% |
| Immigrants | Belarus | 99.9 /100 | #40 | Exceptional 16.5% |
| Cubans | 99.9 /100 | #41 | Exceptional 16.5% |
| Hungarians | 99.9 /100 | #42 | Exceptional 16.5% |
| Immigrants | Canada | 99.8 /100 | #43 | Exceptional 16.5% |
| Macedonians | 99.8 /100 | #44 | Exceptional 16.5% |
| Immigrants | Europe | 99.8 /100 | #45 | Exceptional 16.5% |
| Immigrants | Colombia | 99.8 /100 | #46 | Exceptional 16.5% |
| Immigrants | Italy | 99.8 /100 | #47 | Exceptional 16.5% |
| Immigrants | North America | 99.8 /100 | #48 | Exceptional 16.5% |
| Iranians | 99.8 /100 | #49 | Exceptional 16.5% |
| Norwegians | 99.8 /100 | #50 | Exceptional 16.5% |
| Immigrants | Korea | 99.8 /100 | #51 | Exceptional 16.5% |
| Soviet Union | 99.8 /100 | #52 | Exceptional 16.5% |
| Swedes | 99.8 /100 | #53 | Exceptional 16.5% |
Demographics Similar to Cherokee by Cognitive Disability
In terms of cognitive disability, the demographic groups most similar to Cherokee are Nepalese (18.0%, a difference of 0.010%), Spanish American (18.0%, a difference of 0.070%), Belizean (18.0%, a difference of 0.070%), Menominee (18.0%, a difference of 0.10%), and Honduran (18.0%, a difference of 0.14%).
| Demographics | Rating | Rank | Cognitive Disability |
| Guamanians/Chamorros | 0.5 /100 | #261 | Tragic 17.9% |
| Sierra Leoneans | 0.4 /100 | #262 | Tragic 17.9% |
| Immigrants | Barbados | 0.4 /100 | #263 | Tragic 17.9% |
| Menominee | 0.4 /100 | #264 | Tragic 18.0% |
| Spanish Americans | 0.4 /100 | #265 | Tragic 18.0% |
| Belizeans | 0.4 /100 | #266 | Tragic 18.0% |
| Nepalese | 0.3 /100 | #267 | Tragic 18.0% |
| Cherokee | 0.3 /100 | #268 | Tragic 18.0% |
| Hondurans | 0.3 /100 | #269 | Tragic 18.0% |
| Immigrants | Bahamas | 0.3 /100 | #270 | Tragic 18.0% |
| Potawatomi | 0.2 /100 | #271 | Tragic 18.0% |
| Immigrants | Honduras | 0.2 /100 | #272 | Tragic 18.0% |
| Immigrants | Nepal | 0.2 /100 | #273 | Tragic 18.0% |
| Immigrants | Nigeria | 0.2 /100 | #274 | Tragic 18.0% |
| Immigrants | Laos | 0.2 /100 | #275 | Tragic 18.1% |