Immigrants from China vs Subsaharan African Disability Age 18 to 34
COMPARE
Immigrants from China
Subsaharan African
Disability Age 18 to 34
Disability Age 18 to 34 Comparison
Immigrants from China
Sub-Saharan Africans
5.4%
DISABILITY AGE 18 TO 34
100.0/ 100
METRIC RATING
7th/ 347
METRIC RANK
7.1%
DISABILITY AGE 18 TO 34
1.7/ 100
METRIC RATING
235th/ 347
METRIC RANK
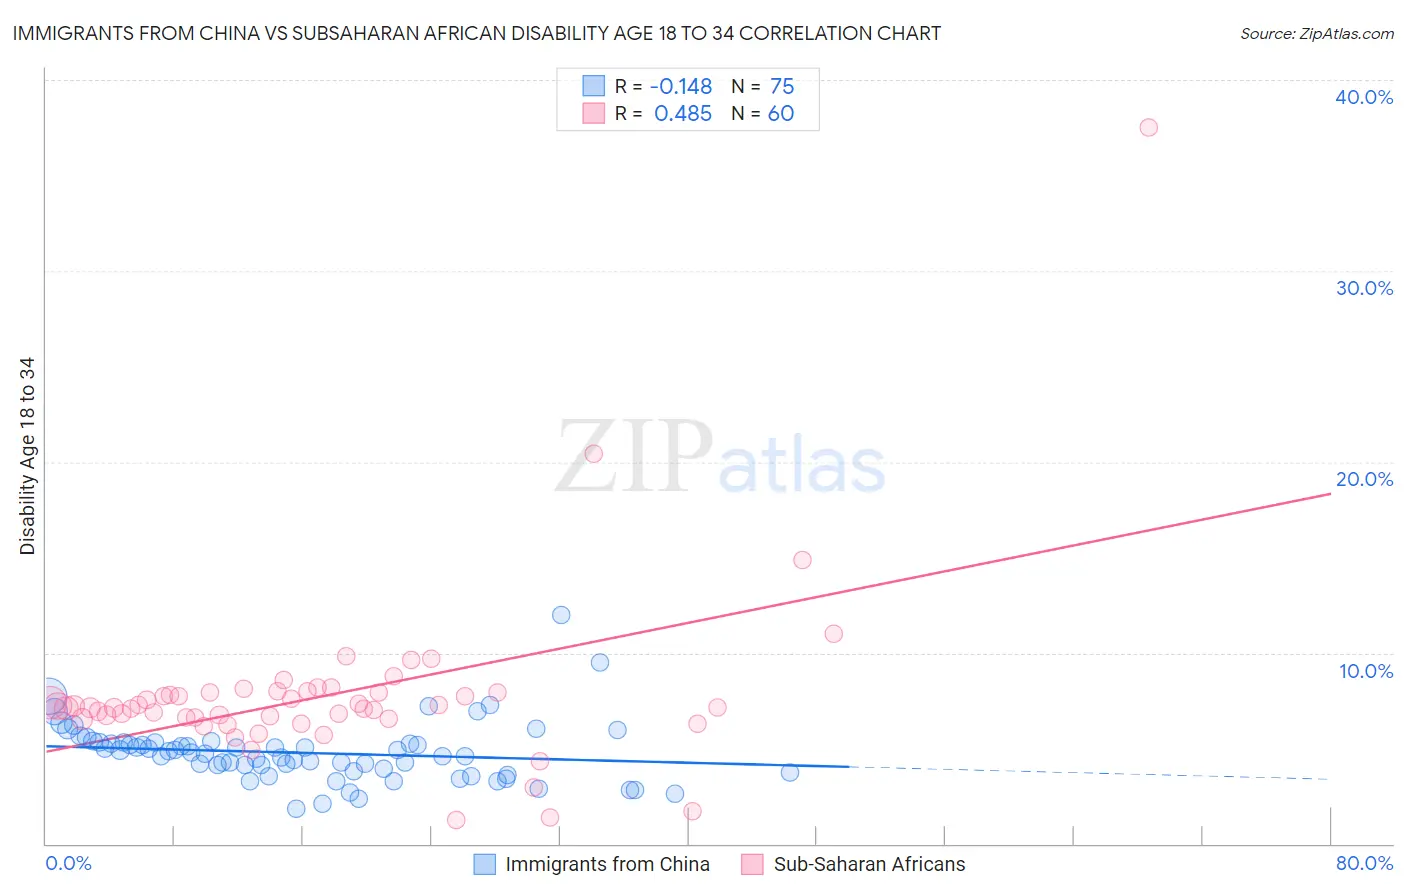
Immigrants from China vs Subsaharan African Disability Age 18 to 34 Correlation Chart
The statistical analysis conducted on geographies consisting of 455,773,705 people shows a poor negative correlation between the proportion of Immigrants from China and percentage of population with a disability between the ages 18 and 35 in the United States with a correlation coefficient (R) of -0.148 and weighted average of 5.4%. Similarly, the statistical analysis conducted on geographies consisting of 506,334,183 people shows a moderate positive correlation between the proportion of Sub-Saharan Africans and percentage of population with a disability between the ages 18 and 35 in the United States with a correlation coefficient (R) of 0.485 and weighted average of 7.1%, a difference of 29.6%.
Disability Age 18 to 34 Correlation Summary
| Measurement | Immigrants from China | Subsaharan African |
| Minimum | 1.8% | 1.2% |
| Maximum | 12.0% | 37.5% |
| Range | 10.2% | 36.3% |
| Mean | 4.8% | 7.8% |
| Median | 4.7% | 7.1% |
| Interquartile 25% (IQ1) | 3.8% | 6.6% |
| Interquartile 75% (IQ3) | 5.3% | 7.9% |
| Interquartile Range (IQR) | 1.5% | 1.4% |
| Standard Deviation (Sample) | 1.6% | 4.7% |
| Standard Deviation (Population) | 1.6% | 4.7% |
Similar Demographics by Disability Age 18 to 34
Demographics Similar to Immigrants from China by Disability Age 18 to 34
In terms of disability age 18 to 34, the demographic groups most similar to Immigrants from China are Filipino (5.4%, a difference of 0.070%), Immigrants from Guyana (5.5%, a difference of 0.56%), Guyanese (5.5%, a difference of 1.1%), Immigrants from Uzbekistan (5.5%, a difference of 1.2%), and Vietnamese (5.5%, a difference of 1.3%).
| Demographics | Rating | Rank | Disability Age 18 to 34 |
| Immigrants | Armenia | 100.0 /100 | #1 | Exceptional 5.0% |
| Immigrants | Hong Kong | 100.0 /100 | #2 | Exceptional 5.2% |
| Immigrants | Grenada | 100.0 /100 | #3 | Exceptional 5.3% |
| Immigrants | Cuba | 100.0 /100 | #4 | Exceptional 5.4% |
| Immigrants | Taiwan | 100.0 /100 | #5 | Exceptional 5.4% |
| Filipinos | 100.0 /100 | #6 | Exceptional 5.4% |
| Immigrants | China | 100.0 /100 | #7 | Exceptional 5.4% |
| Immigrants | Guyana | 100.0 /100 | #8 | Exceptional 5.5% |
| Guyanese | 100.0 /100 | #9 | Exceptional 5.5% |
| Immigrants | Uzbekistan | 100.0 /100 | #10 | Exceptional 5.5% |
| Vietnamese | 100.0 /100 | #11 | Exceptional 5.5% |
| Immigrants | St. Vincent and the Grenadines | 100.0 /100 | #12 | Exceptional 5.5% |
| Immigrants | Iran | 100.0 /100 | #13 | Exceptional 5.5% |
| Indians (Asian) | 100.0 /100 | #14 | Exceptional 5.5% |
| Immigrants | India | 100.0 /100 | #15 | Exceptional 5.6% |
Demographics Similar to Sub-Saharan Africans by Disability Age 18 to 34
In terms of disability age 18 to 34, the demographic groups most similar to Sub-Saharan Africans are Liberian (7.1%, a difference of 0.25%), Alsatian (7.0%, a difference of 0.37%), Austrian (7.1%, a difference of 0.42%), Marshallese (7.1%, a difference of 0.47%), and Italian (7.1%, a difference of 0.58%).
| Demographics | Rating | Rank | Disability Age 18 to 34 |
| Immigrants | Yemen | 4.2 /100 | #228 | Tragic 7.0% |
| Lithuanians | 4.1 /100 | #229 | Tragic 7.0% |
| Immigrants | North America | 3.9 /100 | #230 | Tragic 7.0% |
| Ute | 3.8 /100 | #231 | Tragic 7.0% |
| Samoans | 3.2 /100 | #232 | Tragic 7.0% |
| New Zealanders | 2.7 /100 | #233 | Tragic 7.0% |
| Alsatians | 2.1 /100 | #234 | Tragic 7.0% |
| Sub-Saharan Africans | 1.7 /100 | #235 | Tragic 7.1% |
| Liberians | 1.5 /100 | #236 | Tragic 7.1% |
| Austrians | 1.3 /100 | #237 | Tragic 7.1% |
| Marshallese | 1.3 /100 | #238 | Tragic 7.1% |
| Italians | 1.2 /100 | #239 | Tragic 7.1% |
| Arapaho | 1.1 /100 | #240 | Tragic 7.1% |
| Nepalese | 1.1 /100 | #241 | Tragic 7.1% |
| Immigrants | Congo | 1.1 /100 | #242 | Tragic 7.1% |