Immigrants from China vs Immigrants from South Central Asia Hearing Disability
COMPARE
Immigrants from China
Immigrants from South Central Asia
Hearing Disability
Hearing Disability Comparison
Immigrants from China
Immigrants from South Central Asia
2.6%
HEARING DISABILITY
99.5/ 100
METRIC RATING
39th/ 347
METRIC RANK
2.6%
HEARING DISABILITY
99.7/ 100
METRIC RATING
27th/ 347
METRIC RANK
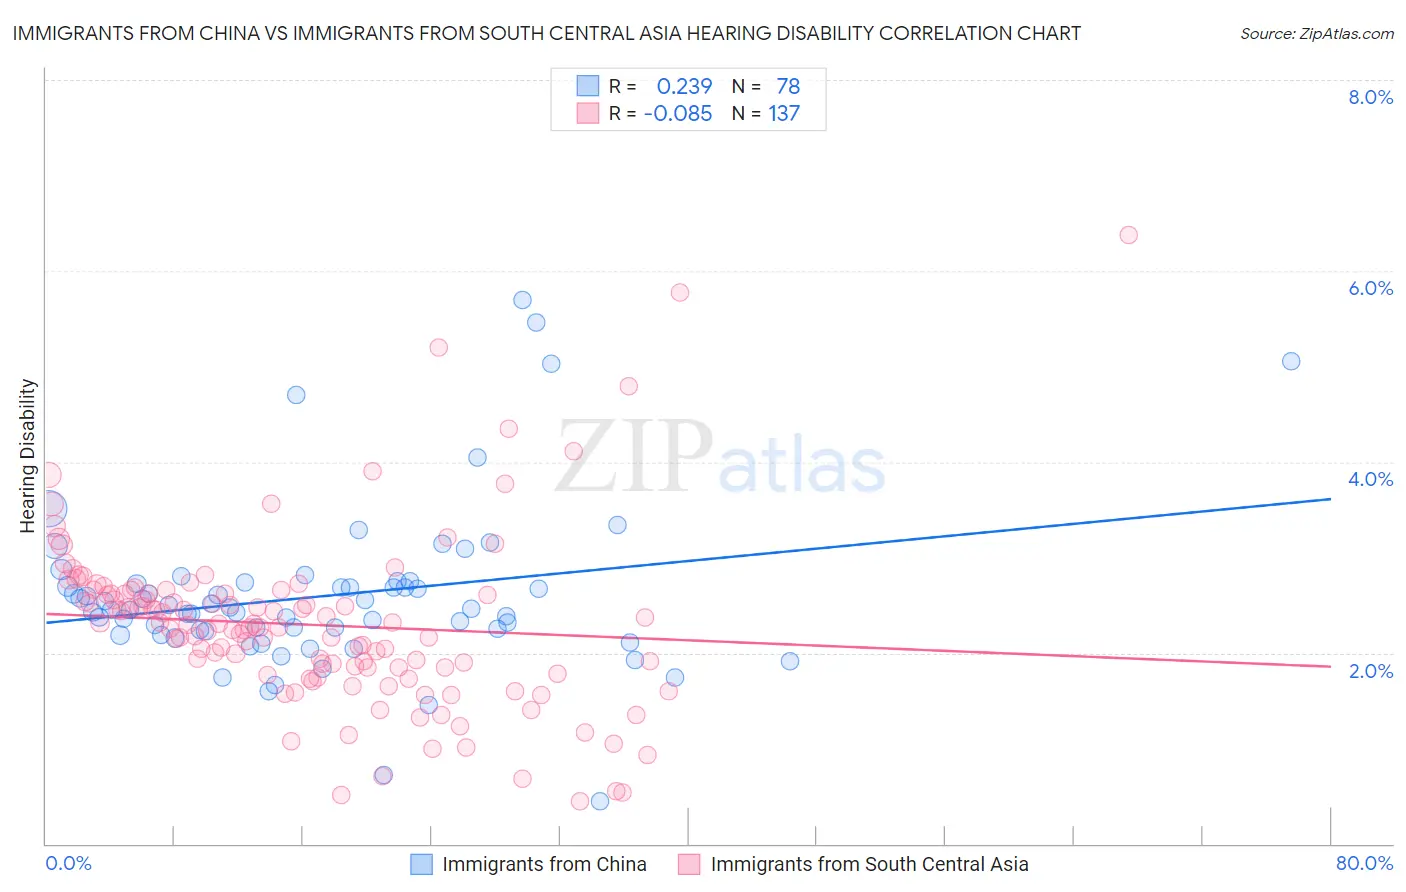
Immigrants from China vs Immigrants from South Central Asia Hearing Disability Correlation Chart
The statistical analysis conducted on geographies consisting of 456,804,939 people shows a weak positive correlation between the proportion of Immigrants from China and percentage of population with hearing disability in the United States with a correlation coefficient (R) of 0.239 and weighted average of 2.6%. Similarly, the statistical analysis conducted on geographies consisting of 472,823,945 people shows a slight negative correlation between the proportion of Immigrants from South Central Asia and percentage of population with hearing disability in the United States with a correlation coefficient (R) of -0.085 and weighted average of 2.6%, a difference of 1.6%.
Hearing Disability Correlation Summary
| Measurement | Immigrants from China | Immigrants from South Central Asia |
| Minimum | 0.45% | 0.44% |
| Maximum | 5.7% | 6.4% |
| Range | 5.2% | 5.9% |
| Mean | 2.6% | 2.3% |
| Median | 2.5% | 2.3% |
| Interquartile 25% (IQ1) | 2.2% | 1.8% |
| Interquartile 75% (IQ3) | 2.7% | 2.6% |
| Interquartile Range (IQR) | 0.49% | 0.81% |
| Standard Deviation (Sample) | 0.87% | 0.91% |
| Standard Deviation (Population) | 0.86% | 0.91% |
Demographics Similar to Immigrants from China and Immigrants from South Central Asia by Hearing Disability
In terms of hearing disability, the demographic groups most similar to Immigrants from China are Haitian (2.6%, a difference of 0.080%), Immigrants from Jamaica (2.6%, a difference of 0.24%), Immigrants from Western Africa (2.6%, a difference of 0.32%), Okinawan (2.6%, a difference of 0.35%), and Immigrants from Taiwan (2.6%, a difference of 0.42%). Similarly, the demographic groups most similar to Immigrants from South Central Asia are Immigrants from Senegal (2.6%, a difference of 0.040%), Immigrants from El Salvador (2.6%, a difference of 0.050%), Immigrants from Haiti (2.6%, a difference of 0.37%), Bolivian (2.6%, a difference of 0.40%), and Immigrants from Ghana (2.6%, a difference of 0.45%).
| Demographics | Rating | Rank | Hearing Disability |
| Immigrants | Nigeria | 99.8 /100 | #23 | Exceptional 2.6% |
| Immigrants | Ghana | 99.8 /100 | #24 | Exceptional 2.6% |
| Immigrants | El Salvador | 99.7 /100 | #25 | Exceptional 2.6% |
| Immigrants | Senegal | 99.7 /100 | #26 | Exceptional 2.6% |
| Immigrants | South Central Asia | 99.7 /100 | #27 | Exceptional 2.6% |
| Immigrants | Haiti | 99.7 /100 | #28 | Exceptional 2.6% |
| Bolivians | 99.7 /100 | #29 | Exceptional 2.6% |
| Immigrants | Caribbean | 99.7 /100 | #30 | Exceptional 2.6% |
| Immigrants | Cameroon | 99.7 /100 | #31 | Exceptional 2.6% |
| Immigrants | Venezuela | 99.7 /100 | #32 | Exceptional 2.6% |
| Filipinos | 99.6 /100 | #33 | Exceptional 2.6% |
| Immigrants | Pakistan | 99.6 /100 | #34 | Exceptional 2.6% |
| Salvadorans | 99.6 /100 | #35 | Exceptional 2.6% |
| Okinawans | 99.6 /100 | #36 | Exceptional 2.6% |
| Immigrants | Western Africa | 99.6 /100 | #37 | Exceptional 2.6% |
| Immigrants | Jamaica | 99.5 /100 | #38 | Exceptional 2.6% |
| Immigrants | China | 99.5 /100 | #39 | Exceptional 2.6% |
| Haitians | 99.5 /100 | #40 | Exceptional 2.6% |
| Immigrants | Taiwan | 99.4 /100 | #41 | Exceptional 2.6% |
| West Indians | 99.4 /100 | #42 | Exceptional 2.6% |
| Senegalese | 99.4 /100 | #43 | Exceptional 2.6% |