Immigrants from Caribbean vs Guamanian/Chamorro Vision Disability
COMPARE
Immigrants from Caribbean
Guamanian/Chamorro
Vision Disability
Vision Disability Comparison
Immigrants from Caribbean
Guamanians/Chamorros
2.5%
VISION DISABILITY
0.0/ 100
METRIC RATING
282nd/ 347
METRIC RANK
2.3%
VISION DISABILITY
3.9/ 100
METRIC RATING
220th/ 347
METRIC RANK
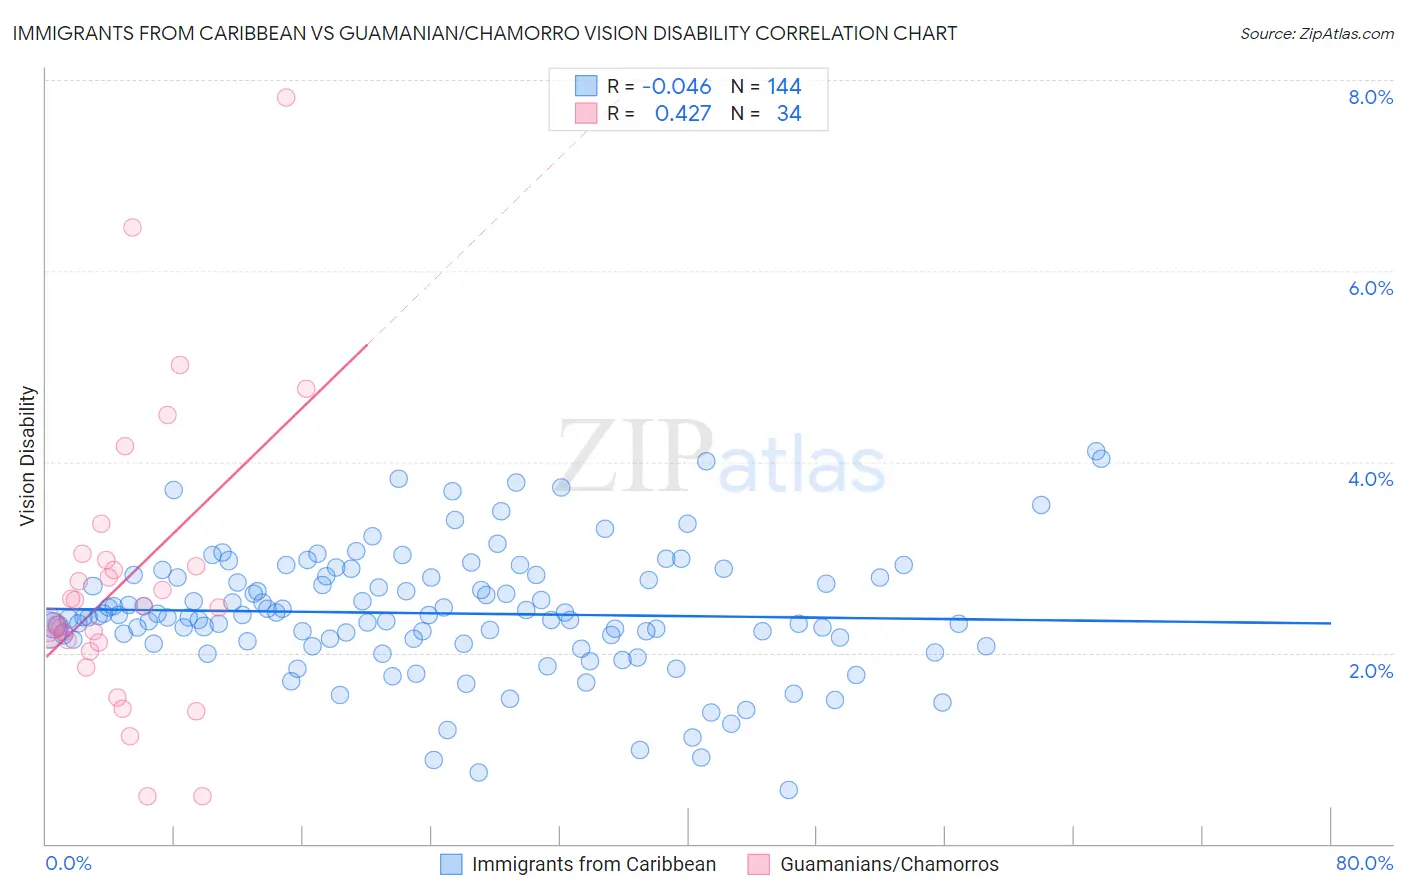
Immigrants from Caribbean vs Guamanian/Chamorro Vision Disability Correlation Chart
The statistical analysis conducted on geographies consisting of 449,351,147 people shows no correlation between the proportion of Immigrants from Caribbean and percentage of population with vision disability in the United States with a correlation coefficient (R) of -0.046 and weighted average of 2.5%. Similarly, the statistical analysis conducted on geographies consisting of 221,799,275 people shows a moderate positive correlation between the proportion of Guamanians/Chamorros and percentage of population with vision disability in the United States with a correlation coefficient (R) of 0.427 and weighted average of 2.3%, a difference of 7.9%.
Vision Disability Correlation Summary
| Measurement | Immigrants from Caribbean | Guamanian/Chamorro |
| Minimum | 0.56% | 0.50% |
| Maximum | 4.1% | 7.8% |
| Range | 3.5% | 7.3% |
| Mean | 2.4% | 2.8% |
| Median | 2.4% | 2.5% |
| Interquartile 25% (IQ1) | 2.1% | 2.1% |
| Interquartile 75% (IQ3) | 2.8% | 3.0% |
| Interquartile Range (IQR) | 0.66% | 0.87% |
| Standard Deviation (Sample) | 0.65% | 1.5% |
| Standard Deviation (Population) | 0.65% | 1.5% |
Similar Demographics by Vision Disability
Demographics Similar to Immigrants from Caribbean by Vision Disability
In terms of vision disability, the demographic groups most similar to Immigrants from Caribbean are U.S. Virgin Islander (2.5%, a difference of 0.12%), Puget Sound Salish (2.5%, a difference of 0.13%), Cape Verdean (2.4%, a difference of 0.35%), Nepalese (2.4%, a difference of 0.39%), and Spanish (2.4%, a difference of 0.40%).
| Demographics | Rating | Rank | Vision Disability |
| Chippewa | 0.0 /100 | #275 | Tragic 2.4% |
| Scotch-Irish | 0.0 /100 | #276 | Tragic 2.4% |
| Bahamians | 0.0 /100 | #277 | Tragic 2.4% |
| Spanish | 0.0 /100 | #278 | Tragic 2.4% |
| Nepalese | 0.0 /100 | #279 | Tragic 2.4% |
| Cape Verdeans | 0.0 /100 | #280 | Tragic 2.4% |
| U.S. Virgin Islanders | 0.0 /100 | #281 | Tragic 2.5% |
| Immigrants | Caribbean | 0.0 /100 | #282 | Tragic 2.5% |
| Puget Sound Salish | 0.0 /100 | #283 | Tragic 2.5% |
| Yakama | 0.0 /100 | #284 | Tragic 2.5% |
| Immigrants | Central America | 0.0 /100 | #285 | Tragic 2.5% |
| Sioux | 0.0 /100 | #286 | Tragic 2.5% |
| Hondurans | 0.0 /100 | #287 | Tragic 2.5% |
| French American Indians | 0.0 /100 | #288 | Tragic 2.5% |
| Immigrants | Nonimmigrants | 0.0 /100 | #289 | Tragic 2.5% |
Demographics Similar to Guamanians/Chamorros by Vision Disability
In terms of vision disability, the demographic groups most similar to Guamanians/Chamorros are French Canadian (2.3%, a difference of 0.020%), Immigrants from Senegal (2.3%, a difference of 0.040%), Basque (2.3%, a difference of 0.18%), Irish (2.3%, a difference of 0.20%), and Immigrants from Western Africa (2.3%, a difference of 0.22%).
| Demographics | Rating | Rank | Vision Disability |
| Immigrants | Ghana | 8.9 /100 | #213 | Tragic 2.2% |
| Trinidadians and Tobagonians | 8.2 /100 | #214 | Tragic 2.2% |
| Nigerians | 7.2 /100 | #215 | Tragic 2.3% |
| Immigrants | Trinidad and Tobago | 6.1 /100 | #216 | Tragic 2.3% |
| Barbadians | 5.1 /100 | #217 | Tragic 2.3% |
| Portuguese | 4.9 /100 | #218 | Tragic 2.3% |
| Ecuadorians | 4.6 /100 | #219 | Tragic 2.3% |
| Guamanians/Chamorros | 3.9 /100 | #220 | Tragic 2.3% |
| French Canadians | 3.9 /100 | #221 | Tragic 2.3% |
| Immigrants | Senegal | 3.8 /100 | #222 | Tragic 2.3% |
| Basques | 3.5 /100 | #223 | Tragic 2.3% |
| Irish | 3.4 /100 | #224 | Tragic 2.3% |
| Immigrants | Western Africa | 3.4 /100 | #225 | Tragic 2.3% |
| Immigrants | Germany | 3.0 /100 | #226 | Tragic 2.3% |
| Hawaiians | 2.9 /100 | #227 | Tragic 2.3% |