Immigrants from Canada vs Macedonian Disability Age 18 to 34
COMPARE
Immigrants from Canada
Macedonian
Disability Age 18 to 34
Disability Age 18 to 34 Comparison
Immigrants from Canada
Macedonians
7.0%
DISABILITY AGE 18 TO 34
4.3/ 100
METRIC RATING
227th/ 347
METRIC RANK
6.3%
DISABILITY AGE 18 TO 34
92.6/ 100
METRIC RATING
125th/ 347
METRIC RANK
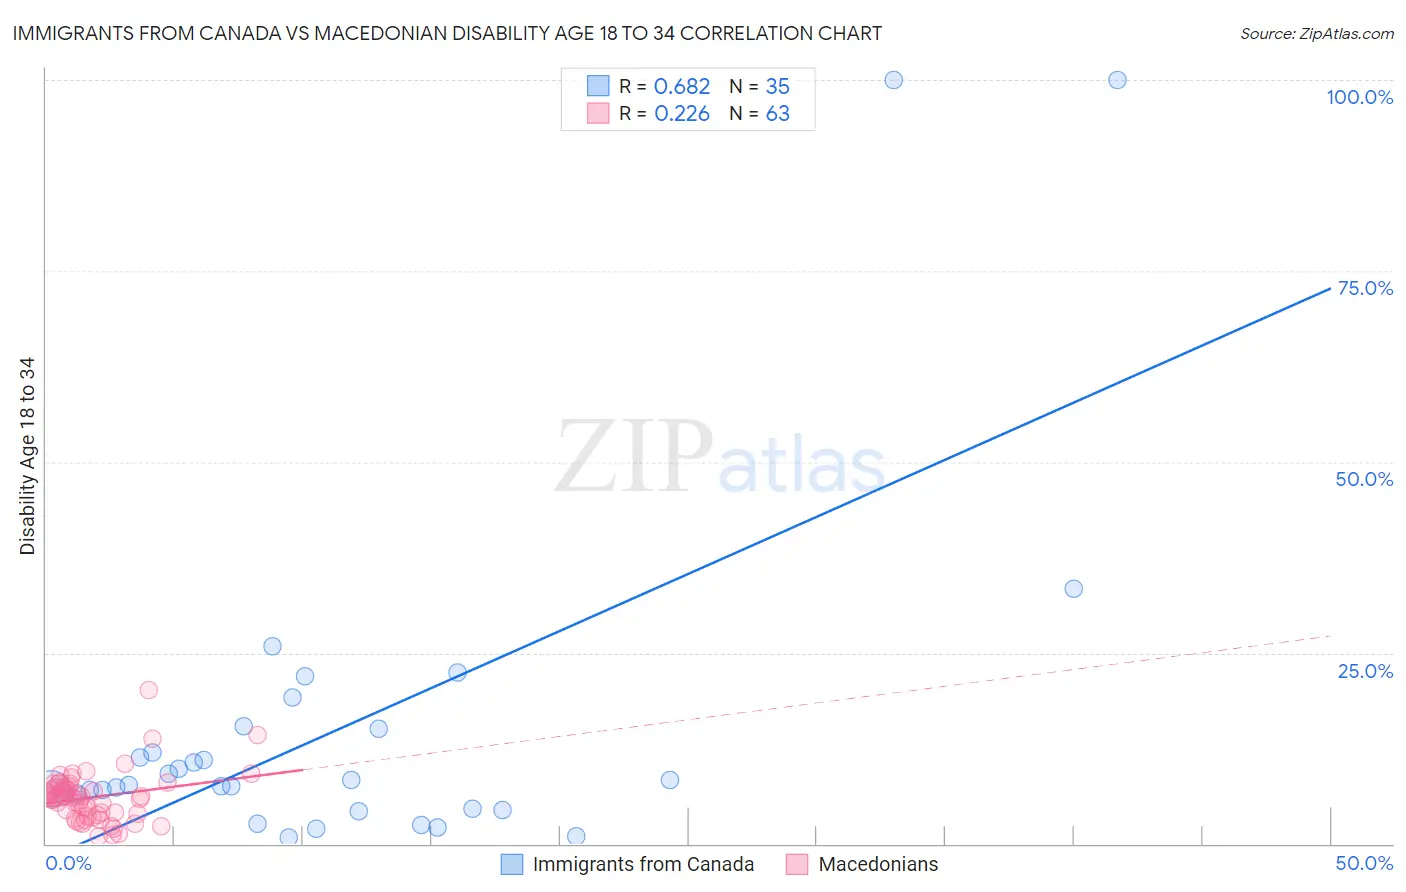
Immigrants from Canada vs Macedonian Disability Age 18 to 34 Correlation Chart
The statistical analysis conducted on geographies consisting of 457,531,429 people shows a significant positive correlation between the proportion of Immigrants from Canada and percentage of population with a disability between the ages 18 and 35 in the United States with a correlation coefficient (R) of 0.682 and weighted average of 7.0%. Similarly, the statistical analysis conducted on geographies consisting of 132,591,648 people shows a weak positive correlation between the proportion of Macedonians and percentage of population with a disability between the ages 18 and 35 in the United States with a correlation coefficient (R) of 0.226 and weighted average of 6.3%, a difference of 10.2%.
Disability Age 18 to 34 Correlation Summary
| Measurement | Immigrants from Canada | Macedonian |
| Minimum | 0.83% | 1.1% |
| Maximum | 100.0% | 20.2% |
| Range | 99.2% | 19.2% |
| Mean | 14.9% | 6.1% |
| Median | 7.7% | 6.1% |
| Interquartile 25% (IQ1) | 4.5% | 3.8% |
| Interquartile 75% (IQ3) | 15.0% | 7.4% |
| Interquartile Range (IQR) | 10.5% | 3.6% |
| Standard Deviation (Sample) | 22.5% | 3.2% |
| Standard Deviation (Population) | 22.1% | 3.2% |
Similar Demographics by Disability Age 18 to 34
Demographics Similar to Immigrants from Canada by Disability Age 18 to 34
In terms of disability age 18 to 34, the demographic groups most similar to Immigrants from Canada are Ugandan (6.9%, a difference of 0.050%), Immigrants from Yemen (7.0%, a difference of 0.050%), Lithuanian (7.0%, a difference of 0.080%), Central American Indian (6.9%, a difference of 0.15%), and Immigrants from North America (7.0%, a difference of 0.18%).
| Demographics | Rating | Rank | Disability Age 18 to 34 |
| Immigrants | Senegal | 5.5 /100 | #220 | Tragic 6.9% |
| Immigrants | Middle Africa | 5.5 /100 | #221 | Tragic 6.9% |
| Immigrants | England | 5.3 /100 | #222 | Tragic 6.9% |
| Carpatho Rusyns | 5.2 /100 | #223 | Tragic 6.9% |
| Senegalese | 4.9 /100 | #224 | Tragic 6.9% |
| Central American Indians | 4.7 /100 | #225 | Tragic 6.9% |
| Ugandans | 4.4 /100 | #226 | Tragic 6.9% |
| Immigrants | Canada | 4.3 /100 | #227 | Tragic 7.0% |
| Immigrants | Yemen | 4.2 /100 | #228 | Tragic 7.0% |
| Lithuanians | 4.1 /100 | #229 | Tragic 7.0% |
| Immigrants | North America | 3.9 /100 | #230 | Tragic 7.0% |
| Ute | 3.8 /100 | #231 | Tragic 7.0% |
| Samoans | 3.2 /100 | #232 | Tragic 7.0% |
| New Zealanders | 2.7 /100 | #233 | Tragic 7.0% |
| Alsatians | 2.1 /100 | #234 | Tragic 7.0% |
Demographics Similar to Macedonians by Disability Age 18 to 34
In terms of disability age 18 to 34, the demographic groups most similar to Macedonians are Immigrants from Switzerland (6.3%, a difference of 0.030%), Immigrants from Morocco (6.3%, a difference of 0.070%), Costa Rican (6.3%, a difference of 0.080%), West Indian (6.3%, a difference of 0.16%), and Chinese (6.3%, a difference of 0.18%).
| Demographics | Rating | Rank | Disability Age 18 to 34 |
| Immigrants | Nepal | 93.7 /100 | #118 | Exceptional 6.3% |
| Chileans | 93.5 /100 | #119 | Exceptional 6.3% |
| Immigrants | Ukraine | 93.4 /100 | #120 | Exceptional 6.3% |
| Immigrants | Guatemala | 93.4 /100 | #121 | Exceptional 6.3% |
| Immigrants | Czechoslovakia | 93.3 /100 | #122 | Exceptional 6.3% |
| Costa Ricans | 92.9 /100 | #123 | Exceptional 6.3% |
| Immigrants | Morocco | 92.9 /100 | #124 | Exceptional 6.3% |
| Macedonians | 92.6 /100 | #125 | Exceptional 6.3% |
| Immigrants | Switzerland | 92.5 /100 | #126 | Exceptional 6.3% |
| West Indians | 92.0 /100 | #127 | Exceptional 6.3% |
| Chinese | 91.9 /100 | #128 | Exceptional 6.3% |
| Immigrants | Italy | 90.5 /100 | #129 | Exceptional 6.3% |
| Immigrants | Dominica | 90.5 /100 | #130 | Exceptional 6.3% |
| Immigrants | Saudi Arabia | 90.4 /100 | #131 | Exceptional 6.3% |
| Guatemalans | 89.6 /100 | #132 | Excellent 6.4% |