Immigrants from Cambodia vs Immigrants from Cuba Disability Age Over 75
COMPARE
Immigrants from Cambodia
Immigrants from Cuba
Disability Age Over 75
Disability Age Over 75 Comparison
Immigrants from Cambodia
Immigrants from Cuba
50.0%
DISABILITY AGE OVER 75
0.0/ 100
METRIC RATING
294th/ 347
METRIC RANK
47.7%
DISABILITY AGE OVER 75
20.9/ 100
METRIC RATING
201st/ 347
METRIC RANK
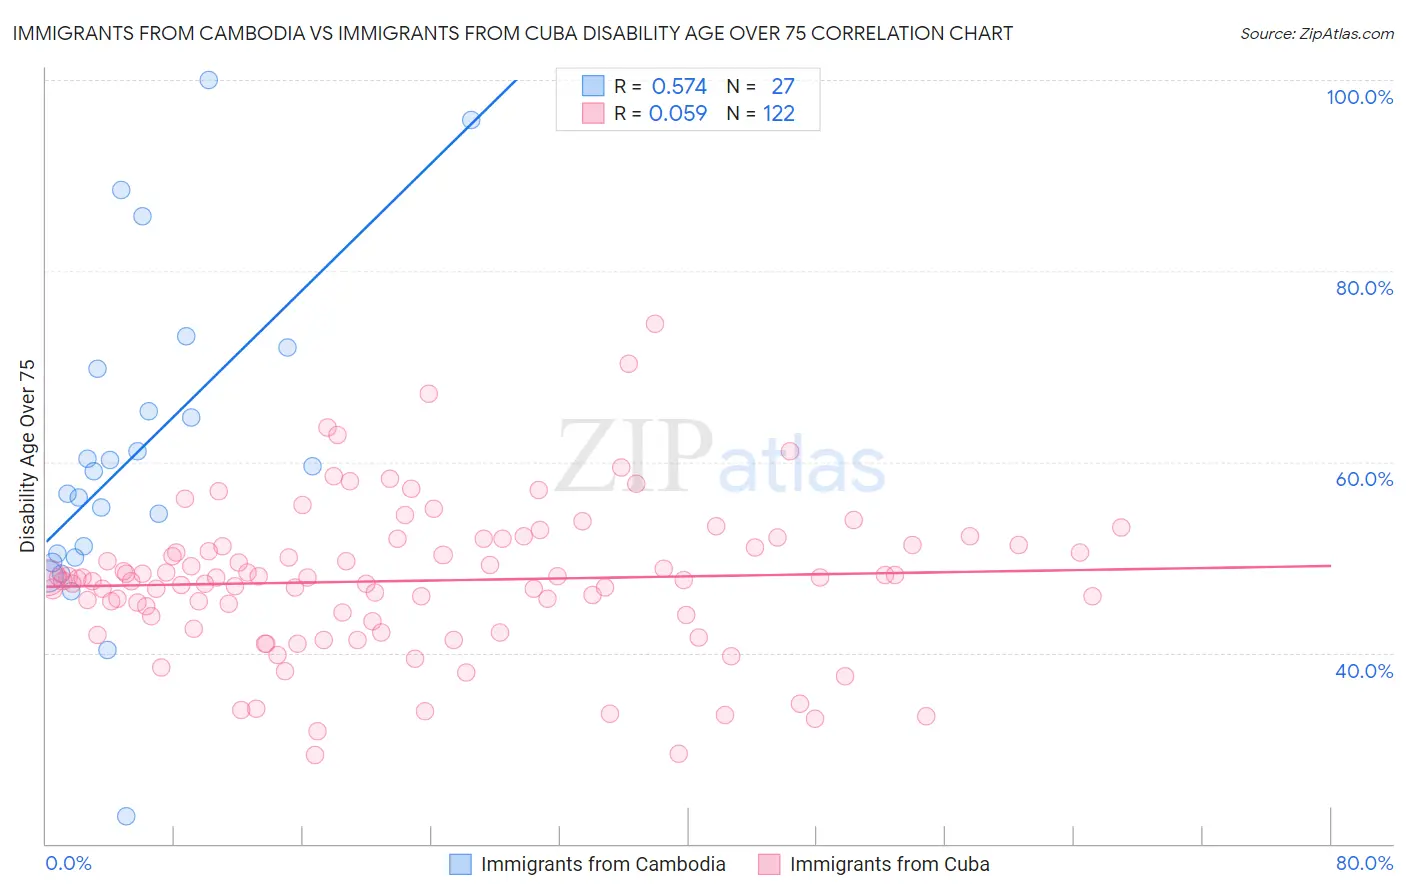
Immigrants from Cambodia vs Immigrants from Cuba Disability Age Over 75 Correlation Chart
The statistical analysis conducted on geographies consisting of 205,096,064 people shows a substantial positive correlation between the proportion of Immigrants from Cambodia and percentage of population with a disability over the age of 75 in the United States with a correlation coefficient (R) of 0.574 and weighted average of 50.0%. Similarly, the statistical analysis conducted on geographies consisting of 325,674,246 people shows a slight positive correlation between the proportion of Immigrants from Cuba and percentage of population with a disability over the age of 75 in the United States with a correlation coefficient (R) of 0.059 and weighted average of 47.7%, a difference of 4.8%.
Disability Age Over 75 Correlation Summary
| Measurement | Immigrants from Cambodia | Immigrants from Cuba |
| Minimum | 22.9% | 29.3% |
| Maximum | 100.0% | 74.4% |
| Range | 77.1% | 45.1% |
| Mean | 60.9% | 47.5% |
| Median | 59.1% | 47.8% |
| Interquartile 25% (IQ1) | 50.0% | 43.9% |
| Interquartile 75% (IQ3) | 69.8% | 51.2% |
| Interquartile Range (IQR) | 19.8% | 7.3% |
| Standard Deviation (Sample) | 17.0% | 7.8% |
| Standard Deviation (Population) | 16.7% | 7.7% |
Similar Demographics by Disability Age Over 75
Demographics Similar to Immigrants from Cambodia by Disability Age Over 75
In terms of disability age over 75, the demographic groups most similar to Immigrants from Cambodia are Spanish American (50.0%, a difference of 0.040%), Mexican American Indian (50.0%, a difference of 0.080%), Armenian (50.0%, a difference of 0.10%), Spanish American Indian (49.9%, a difference of 0.12%), and Marshallese (50.1%, a difference of 0.16%).
| Demographics | Rating | Rank | Disability Age Over 75 |
| Sioux | 0.0 /100 | #287 | Tragic 49.7% |
| Yaqui | 0.0 /100 | #288 | Tragic 49.8% |
| Osage | 0.0 /100 | #289 | Tragic 49.8% |
| Puget Sound Salish | 0.0 /100 | #290 | Tragic 49.8% |
| Arapaho | 0.0 /100 | #291 | Tragic 49.8% |
| Shoshone | 0.0 /100 | #292 | Tragic 49.9% |
| Spanish American Indians | 0.0 /100 | #293 | Tragic 49.9% |
| Immigrants | Cambodia | 0.0 /100 | #294 | Tragic 50.0% |
| Spanish Americans | 0.0 /100 | #295 | Tragic 50.0% |
| Mexican American Indians | 0.0 /100 | #296 | Tragic 50.0% |
| Armenians | 0.0 /100 | #297 | Tragic 50.0% |
| Marshallese | 0.0 /100 | #298 | Tragic 50.1% |
| Immigrants | Micronesia | 0.0 /100 | #299 | Tragic 50.1% |
| Cape Verdeans | 0.0 /100 | #300 | Tragic 50.1% |
| Dominicans | 0.0 /100 | #301 | Tragic 50.2% |
Demographics Similar to Immigrants from Cuba by Disability Age Over 75
In terms of disability age over 75, the demographic groups most similar to Immigrants from Cuba are Immigrants from Bahamas (47.7%, a difference of 0.010%), Immigrants from Somalia (47.7%, a difference of 0.020%), Trinidadian and Tobagonian (47.7%, a difference of 0.030%), Immigrants from Eritrea (47.7%, a difference of 0.050%), and Nigerian (47.7%, a difference of 0.060%).
| Demographics | Rating | Rank | Disability Age Over 75 |
| Immigrants | Lebanon | 26.5 /100 | #194 | Fair 47.6% |
| Immigrants | Trinidad and Tobago | 25.3 /100 | #195 | Fair 47.6% |
| Immigrants | Portugal | 23.8 /100 | #196 | Fair 47.6% |
| Pakistanis | 23.4 /100 | #197 | Fair 47.7% |
| Immigrants | Ukraine | 23.2 /100 | #198 | Fair 47.7% |
| Immigrants | Eritrea | 22.4 /100 | #199 | Fair 47.7% |
| Immigrants | Somalia | 21.4 /100 | #200 | Fair 47.7% |
| Immigrants | Cuba | 20.9 /100 | #201 | Fair 47.7% |
| Immigrants | Bahamas | 20.7 /100 | #202 | Fair 47.7% |
| Trinidadians and Tobagonians | 20.0 /100 | #203 | Fair 47.7% |
| Nigerians | 19.2 /100 | #204 | Poor 47.7% |
| Immigrants | Ghana | 19.1 /100 | #205 | Poor 47.7% |
| Jamaicans | 19.0 /100 | #206 | Poor 47.7% |
| Immigrants | Syria | 17.4 /100 | #207 | Poor 47.8% |
| Immigrants | Senegal | 16.9 /100 | #208 | Poor 47.8% |