Immigrants from Bulgaria vs Immigrants from Panama Hearing Disability
COMPARE
Immigrants from Bulgaria
Immigrants from Panama
Hearing Disability
Hearing Disability Comparison
Immigrants from Bulgaria
Immigrants from Panama
2.9%
HEARING DISABILITY
79.2/ 100
METRIC RATING
144th/ 347
METRIC RANK
2.9%
HEARING DISABILITY
76.9/ 100
METRIC RATING
149th/ 347
METRIC RANK
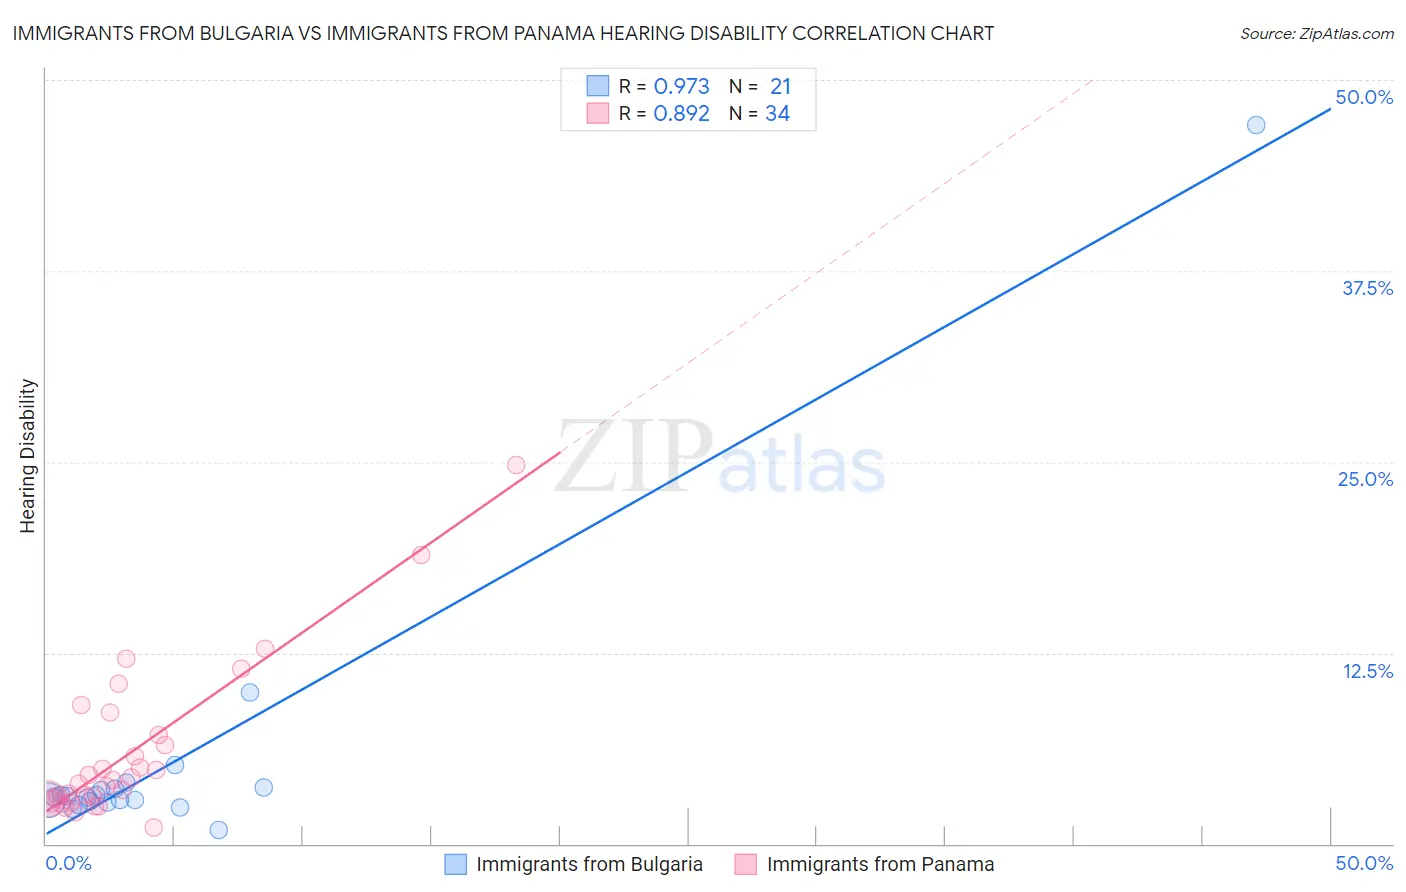
Immigrants from Bulgaria vs Immigrants from Panama Hearing Disability Correlation Chart
The statistical analysis conducted on geographies consisting of 172,536,031 people shows a perfect positive correlation between the proportion of Immigrants from Bulgaria and percentage of population with hearing disability in the United States with a correlation coefficient (R) of 0.973 and weighted average of 2.9%. Similarly, the statistical analysis conducted on geographies consisting of 221,167,736 people shows a very strong positive correlation between the proportion of Immigrants from Panama and percentage of population with hearing disability in the United States with a correlation coefficient (R) of 0.892 and weighted average of 2.9%, a difference of 0.33%.
Hearing Disability Correlation Summary
| Measurement | Immigrants from Bulgaria | Immigrants from Panama |
| Minimum | 0.89% | 1.1% |
| Maximum | 47.1% | 24.8% |
| Range | 46.2% | 23.7% |
| Mean | 5.5% | 6.0% |
| Median | 3.1% | 4.0% |
| Interquartile 25% (IQ1) | 2.8% | 3.0% |
| Interquartile 75% (IQ3) | 3.6% | 7.1% |
| Interquartile Range (IQR) | 0.89% | 4.1% |
| Standard Deviation (Sample) | 9.7% | 5.1% |
| Standard Deviation (Population) | 9.4% | 5.0% |
Demographics Similar to Immigrants from Bulgaria and Immigrants from Panama by Hearing Disability
In terms of hearing disability, the demographic groups most similar to Immigrants from Bulgaria are Immigrants from Congo (2.9%, a difference of 0.050%), Brazilian (2.9%, a difference of 0.070%), Tongan (2.9%, a difference of 0.080%), Immigrants from Russia (2.9%, a difference of 0.21%), and Immigrants from Bahamas (2.9%, a difference of 0.27%). Similarly, the demographic groups most similar to Immigrants from Panama are Immigrants from Russia (2.9%, a difference of 0.11%), Tongan (2.9%, a difference of 0.25%), Brazilian (2.9%, a difference of 0.26%), Immigrants from Congo (2.9%, a difference of 0.28%), and Palestinian (2.9%, a difference of 0.42%).
| Demographics | Rating | Rank | Hearing Disability |
| Immigrants | Brazil | 84.6 /100 | #136 | Excellent 2.9% |
| Sri Lankans | 84.1 /100 | #137 | Excellent 2.9% |
| Immigrants | Costa Rica | 84.0 /100 | #138 | Excellent 2.9% |
| Bermudans | 83.8 /100 | #139 | Excellent 2.9% |
| Immigrants | Jordan | 83.7 /100 | #140 | Excellent 2.9% |
| Sub-Saharan Africans | 83.3 /100 | #141 | Excellent 2.9% |
| Laotians | 81.1 /100 | #142 | Excellent 2.9% |
| Immigrants | Bahamas | 80.9 /100 | #143 | Excellent 2.9% |
| Immigrants | Bulgaria | 79.2 /100 | #144 | Good 2.9% |
| Immigrants | Congo | 78.9 /100 | #145 | Good 2.9% |
| Brazilians | 78.7 /100 | #146 | Good 2.9% |
| Tongans | 78.6 /100 | #147 | Good 2.9% |
| Immigrants | Russia | 77.7 /100 | #148 | Good 2.9% |
| Immigrants | Panama | 76.9 /100 | #149 | Good 2.9% |
| Palestinians | 73.6 /100 | #150 | Good 2.9% |
| Immigrants | France | 73.1 /100 | #151 | Good 2.9% |
| Immigrants | Lithuania | 73.0 /100 | #152 | Good 2.9% |
| Sudanese | 72.1 /100 | #153 | Good 2.9% |
| Immigrants | Lebanon | 71.5 /100 | #154 | Good 2.9% |
| Costa Ricans | 71.4 /100 | #155 | Good 2.9% |
| Immigrants | Poland | 70.2 /100 | #156 | Good 2.9% |