Immigrants from Bulgaria vs Immigrants from Korea Disability Age Over 75
COMPARE
Immigrants from Bulgaria
Immigrants from Korea
Disability Age Over 75
Disability Age Over 75 Comparison
Immigrants from Bulgaria
Immigrants from Korea
45.5%
DISABILITY AGE OVER 75
99.9/ 100
METRIC RATING
31st/ 347
METRIC RANK
45.8%
DISABILITY AGE OVER 75
99.7/ 100
METRIC RATING
51st/ 347
METRIC RANK
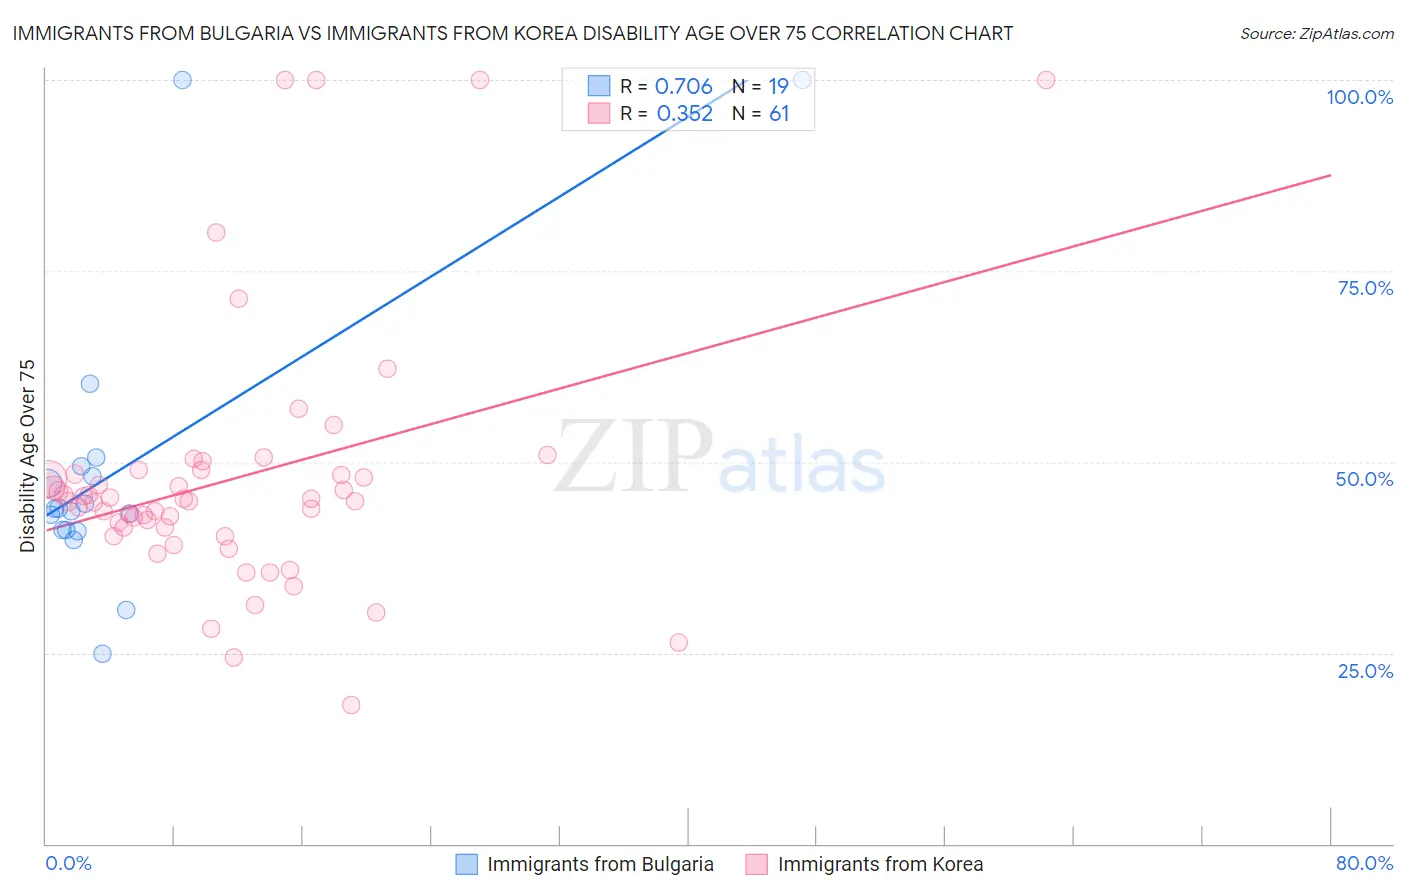
Immigrants from Bulgaria vs Immigrants from Korea Disability Age Over 75 Correlation Chart
The statistical analysis conducted on geographies consisting of 172,507,314 people shows a strong positive correlation between the proportion of Immigrants from Bulgaria and percentage of population with a disability over the age of 75 in the United States with a correlation coefficient (R) of 0.706 and weighted average of 45.5%. Similarly, the statistical analysis conducted on geographies consisting of 415,245,422 people shows a mild positive correlation between the proportion of Immigrants from Korea and percentage of population with a disability over the age of 75 in the United States with a correlation coefficient (R) of 0.352 and weighted average of 45.8%, a difference of 0.70%.
Disability Age Over 75 Correlation Summary
| Measurement | Immigrants from Bulgaria | Immigrants from Korea |
| Minimum | 24.9% | 18.2% |
| Maximum | 100.0% | 100.0% |
| Range | 75.1% | 81.8% |
| Mean | 49.3% | 47.7% |
| Median | 43.9% | 44.9% |
| Interquartile 25% (IQ1) | 41.0% | 40.9% |
| Interquartile 75% (IQ3) | 49.5% | 48.6% |
| Interquartile Range (IQR) | 8.5% | 7.8% |
| Standard Deviation (Sample) | 19.3% | 16.9% |
| Standard Deviation (Population) | 18.8% | 16.7% |
Demographics Similar to Immigrants from Bulgaria and Immigrants from Korea by Disability Age Over 75
In terms of disability age over 75, the demographic groups most similar to Immigrants from Bulgaria are Immigrants from Australia (45.5%, a difference of 0.030%), Immigrants from Croatia (45.5%, a difference of 0.10%), Russian (45.5%, a difference of 0.13%), Norwegian (45.5%, a difference of 0.14%), and Immigrants from Taiwan (45.5%, a difference of 0.17%). Similarly, the demographic groups most similar to Immigrants from Korea are Belgian (45.8%, a difference of 0.0%), Immigrants from North America (45.7%, a difference of 0.13%), Croatian (45.7%, a difference of 0.20%), Immigrants from Canada (45.7%, a difference of 0.21%), and Swedish (45.7%, a difference of 0.22%).
| Demographics | Rating | Rank | Disability Age Over 75 |
| Immigrants | Bulgaria | 99.9 /100 | #31 | Exceptional 45.5% |
| Immigrants | Australia | 99.9 /100 | #32 | Exceptional 45.5% |
| Immigrants | Croatia | 99.9 /100 | #33 | Exceptional 45.5% |
| Russians | 99.9 /100 | #34 | Exceptional 45.5% |
| Norwegians | 99.9 /100 | #35 | Exceptional 45.5% |
| Immigrants | Taiwan | 99.9 /100 | #36 | Exceptional 45.5% |
| South Africans | 99.9 /100 | #37 | Exceptional 45.5% |
| Italians | 99.9 /100 | #38 | Exceptional 45.6% |
| Estonians | 99.9 /100 | #39 | Exceptional 45.6% |
| Slovenes | 99.9 /100 | #40 | Exceptional 45.6% |
| Immigrants | Singapore | 99.8 /100 | #41 | Exceptional 45.6% |
| Greeks | 99.8 /100 | #42 | Exceptional 45.6% |
| Czechs | 99.8 /100 | #43 | Exceptional 45.7% |
| Australians | 99.8 /100 | #44 | Exceptional 45.7% |
| Turks | 99.8 /100 | #45 | Exceptional 45.7% |
| Swedes | 99.8 /100 | #46 | Exceptional 45.7% |
| Immigrants | Canada | 99.8 /100 | #47 | Exceptional 45.7% |
| Croatians | 99.8 /100 | #48 | Exceptional 45.7% |
| Immigrants | North America | 99.8 /100 | #49 | Exceptional 45.7% |
| Belgians | 99.7 /100 | #50 | Exceptional 45.8% |
| Immigrants | Korea | 99.7 /100 | #51 | Exceptional 45.8% |