Immigrants from Brazil vs Honduran Disability Age 18 to 34
COMPARE
Immigrants from Brazil
Honduran
Disability Age 18 to 34
Disability Age 18 to 34 Comparison
Immigrants from Brazil
Hondurans
6.3%
DISABILITY AGE 18 TO 34
95.2/ 100
METRIC RATING
110th/ 347
METRIC RANK
6.4%
DISABILITY AGE 18 TO 34
83.1/ 100
METRIC RATING
149th/ 347
METRIC RANK
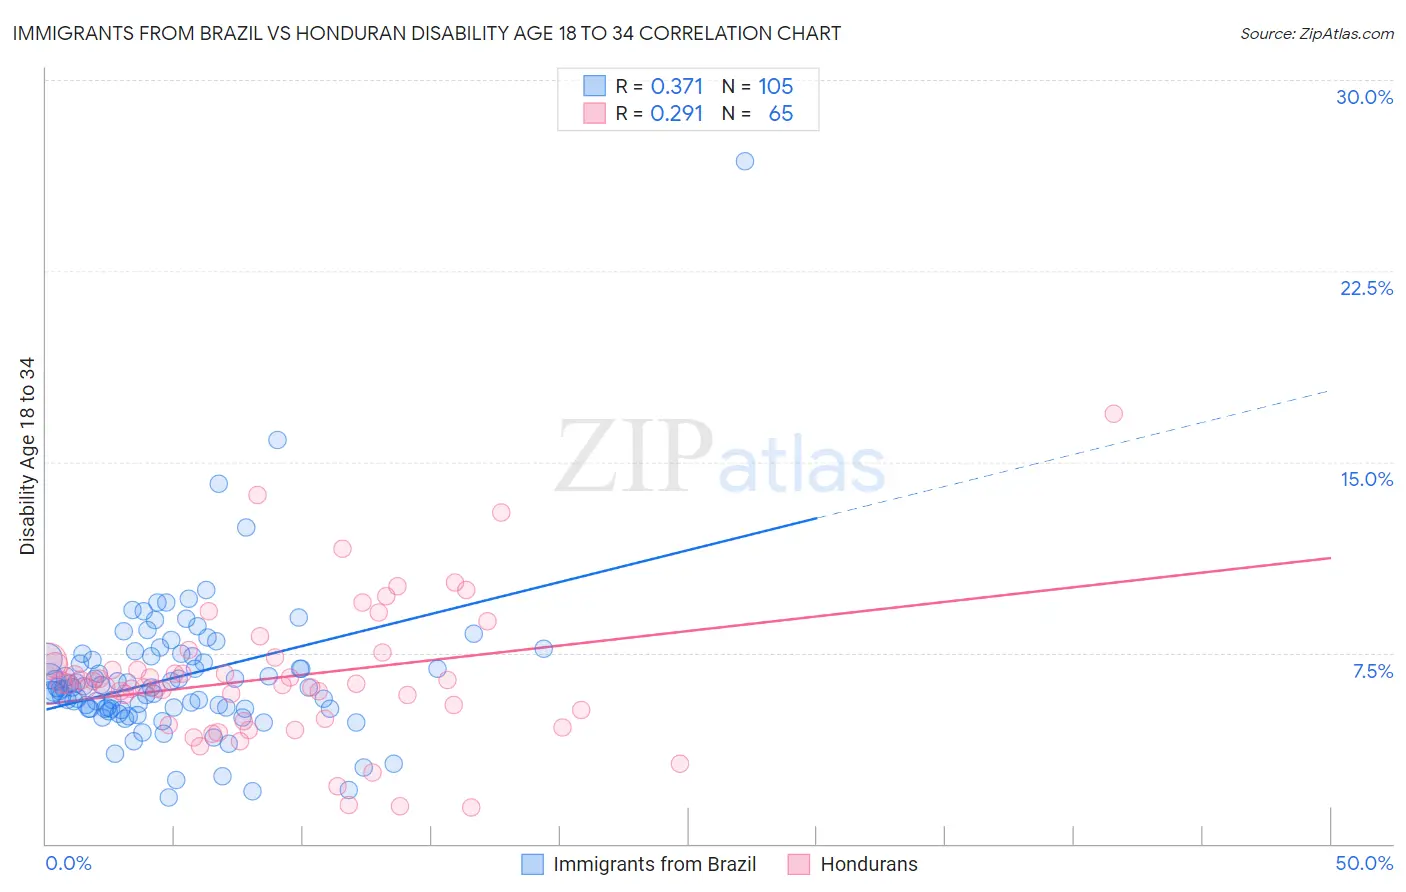
Immigrants from Brazil vs Honduran Disability Age 18 to 34 Correlation Chart
The statistical analysis conducted on geographies consisting of 342,494,358 people shows a mild positive correlation between the proportion of Immigrants from Brazil and percentage of population with a disability between the ages 18 and 35 in the United States with a correlation coefficient (R) of 0.371 and weighted average of 6.3%. Similarly, the statistical analysis conducted on geographies consisting of 357,370,042 people shows a weak positive correlation between the proportion of Hondurans and percentage of population with a disability between the ages 18 and 35 in the United States with a correlation coefficient (R) of 0.291 and weighted average of 6.4%, a difference of 2.5%.
Disability Age 18 to 34 Correlation Summary
| Measurement | Immigrants from Brazil | Honduran |
| Minimum | 1.8% | 1.4% |
| Maximum | 26.8% | 16.9% |
| Range | 25.0% | 15.5% |
| Mean | 6.5% | 6.5% |
| Median | 6.1% | 6.3% |
| Interquartile 25% (IQ1) | 5.3% | 4.9% |
| Interquartile 75% (IQ3) | 7.3% | 7.2% |
| Interquartile Range (IQR) | 2.1% | 2.3% |
| Standard Deviation (Sample) | 2.9% | 2.8% |
| Standard Deviation (Population) | 2.9% | 2.7% |
Similar Demographics by Disability Age 18 to 34
Demographics Similar to Immigrants from Brazil by Disability Age 18 to 34
In terms of disability age 18 to 34, the demographic groups most similar to Immigrants from Brazil are Immigrants from France (6.3%, a difference of 0.0%), Immigrants from Romania (6.3%, a difference of 0.10%), Immigrants from Latin America (6.3%, a difference of 0.10%), Sri Lankan (6.2%, a difference of 0.16%), and Immigrants from Croatia (6.2%, a difference of 0.21%).
| Demographics | Rating | Rank | Disability Age 18 to 34 |
| Immigrants | Bulgaria | 96.3 /100 | #103 | Exceptional 6.2% |
| Mongolians | 96.2 /100 | #104 | Exceptional 6.2% |
| Bhutanese | 96.2 /100 | #105 | Exceptional 6.2% |
| Immigrants | Afghanistan | 95.9 /100 | #106 | Exceptional 6.2% |
| Ethiopians | 95.8 /100 | #107 | Exceptional 6.2% |
| Immigrants | Croatia | 95.7 /100 | #108 | Exceptional 6.2% |
| Sri Lankans | 95.5 /100 | #109 | Exceptional 6.2% |
| Immigrants | Brazil | 95.2 /100 | #110 | Exceptional 6.3% |
| Immigrants | France | 95.1 /100 | #111 | Exceptional 6.3% |
| Immigrants | Romania | 94.9 /100 | #112 | Exceptional 6.3% |
| Immigrants | Latin America | 94.9 /100 | #113 | Exceptional 6.3% |
| Immigrants | South Eastern Asia | 94.4 /100 | #114 | Exceptional 6.3% |
| Koreans | 94.1 /100 | #115 | Exceptional 6.3% |
| Immigrants | Costa Rica | 94.0 /100 | #116 | Exceptional 6.3% |
| Immigrants | Jordan | 94.0 /100 | #117 | Exceptional 6.3% |
Demographics Similar to Hondurans by Disability Age 18 to 34
In terms of disability age 18 to 34, the demographic groups most similar to Hondurans are Immigrants from Dominican Republic (6.4%, a difference of 0.040%), Immigrants from Belgium (6.4%, a difference of 0.060%), Immigrants from South Africa (6.4%, a difference of 0.070%), Tongan (6.4%, a difference of 0.15%), and Belizean (6.4%, a difference of 0.24%).
| Demographics | Rating | Rank | Disability Age 18 to 34 |
| South American Indians | 86.5 /100 | #142 | Excellent 6.4% |
| Immigrants | Latvia | 86.4 /100 | #143 | Excellent 6.4% |
| Albanians | 85.3 /100 | #144 | Excellent 6.4% |
| Moroccans | 85.2 /100 | #145 | Excellent 6.4% |
| Belizeans | 84.9 /100 | #146 | Excellent 6.4% |
| Immigrants | South Africa | 83.7 /100 | #147 | Excellent 6.4% |
| Immigrants | Belgium | 83.5 /100 | #148 | Excellent 6.4% |
| Hondurans | 83.1 /100 | #149 | Excellent 6.4% |
| Immigrants | Dominican Republic | 82.7 /100 | #150 | Excellent 6.4% |
| Tongans | 81.9 /100 | #151 | Excellent 6.4% |
| Bulgarians | 78.3 /100 | #152 | Good 6.5% |
| Immigrants | Eritrea | 77.4 /100 | #153 | Good 6.5% |
| Immigrants | Central America | 76.8 /100 | #154 | Good 6.5% |
| Inupiat | 76.7 /100 | #155 | Good 6.5% |
| Immigrants | Panama | 75.3 /100 | #156 | Good 6.5% |